
Application Note
Beer analysis using the QuickDrop UV-Vis Spectrophotometer
- 4 second read time for quick analysis
- Wide absorbance range (190 nm – 1100 nm)
- Custom equation editor allows users to save methods for complex calculations
Introduction
Beer is one of the world’s most popular beverages, and it can be dated back as early as 6000 BCE from Sumerian artifacts1. The brewing process mainly involves water, a sugar source, flavoring/bittering agents (hops), and brewer’s yeast. Put simply, the brewer creates a nutrient-rich environment for the yeast to metabolize the sugar into alcohol and CO2 and adds secondary elements that influence flavor. Over time, the brewing process has become much more complex. As such, brewers must have excellent quality control processes to ensure a high-quality and consistent taste for all their batches.
The American Society of Brewing Chemists (ASBC) has compiled a comprehensive list of procedures to analyze beer characteristics throughout the entire brewing process. Most of these procedures can be performed on a ultraviolet-visible (UV-Vis) spectrophotometer.
In this application note, we examined color, bitterness, and free-amino nitrogen levels (FAN’s) in four different beers on the SpectraMax® QuickDrop™ Micro-Volume UV-Vis Spectrophotometer. These attributes are commonly measured during and after the brewing process to assess beer quality and troubleshoot potential problems.
Materials
- SpectraMax QuickDrop Micro- Volume UV-Vis Spectrophotometer (Molecular Devices cat. #QUICKDROP)
- Plastic cuvettes (Sigma-Aldrich cat. #Z330388)
- 10mm Far UV Quartz Cuvettes (Starna Cells cat. #9-Q-10)
- Buffers for FAN measurement
- Ninhydrin Reagent
- Ninhydrin (Sigma-Aldrich cat. #151173)
- Potassium phosphate monobasic (Sigma-Aldrich cat. #P0662)
- Fructose (Sigma-Aldrich cat. #F0127)
- Sodium phosphate dibasic (Sigma-Aldrich cat. #S3264)
- Deionized (DI) H 2 O
- Dilution Solution
- Potassium Iodide (Sigma-Aldrich cat. #221945)
- Ethanol (Fisher Scientific cat. #BP2818)
- DI H <sub> 2 </sub> O
- Glycine Stock Solution
- Glycine (Sigma-Aldrich cat. #410225)
- Deionized (DI) H <sub> 2O </sub>
- Octane (Millipore cat. #104718)
- Hydrochloric acid (Fisher Scientific cat. #A144S-500)
- Ninhydrin Reagent
- Beer Samples
- India Pale Ale (IPA)
- Double IPA
- Black IPA
- Citrus Wit
Methods
Protocols were based on ASBC Methods of Analysis2, 3, 4. The 10-mm cuvette port was used for all measurements.
Buffer preparation
For the ninhydrin reagent, 10 g sodium phosphate dibasic, 6 g potassium phosphate, 0.5 g ninhydrin, and 0.3 g fructose were dissolved in 100 mL DI H2O. Dilution solution was prepared by dissolving 0.5 g of potassium iodide in 150 mL distilled water and 100 mL of 96% ethanol.
Color
Beer samples were transferred to a 10 mm cuvette and measured on the QuickDrop at 430 nm. Due to haziness, the citrus wit beer had to be filtered and spun down before measurement.
Bitterness
10 mL of sample was transferred to a 50-mL conical tube. 1 mL of 3N HCl, 20 mL of Isooctane, and 50 μL of octanol were added to the same conical tube. Samples were shaken for 15 minutes until emulsions formed. Afterwards, samples were centrifuged for 3 minutes at 1000 rpm to separate the aqueous layer from the organic layer. Aliquots from the organic layer were pipetted into a quartz cuvette, and absorbance was measured at 275 nm.
FAN levels
1 mL of sample was diluted with 49 mL of DI H2O. 2 mL of diluted sample, water, and glycine standard (2 mg/L) were pipetted into separate glass test tubes. 1 mL of ninhydrin reagent was added to each tube. Samples were heated on a heat block at 100°C for 16 minutes, and afterwards, samples were cooled down to 20°C for 20 minutes. 5 mL of dilution solution was added to samples and mixed thoroughly. Absorbance was measured at 570 nm on the QuickDrop Equation 1 was used to calculate FAN levels.
Equation 1
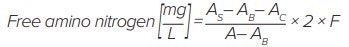
AS = average absorbance of the sample
AG = average absorbance of the glycine standard sollution
AB = average absorbance of the blank value (H2O)
AC = average absorbance of the correction for dark wort and beer
F = dilution factor of the sample
2 = concentration of the glycine standard solution in mg/L
Results
Beer color is one of the first properties noticed by customers. Color is important not only in beer classification, but also in identifying problems during the brewing process. We measured color using the QuickDrop based on the ASBC protocol2. Results were reported in Standard Reference Method units (SRM) in Figure 1. Beer color was consistent with the brewing company’s color tests.
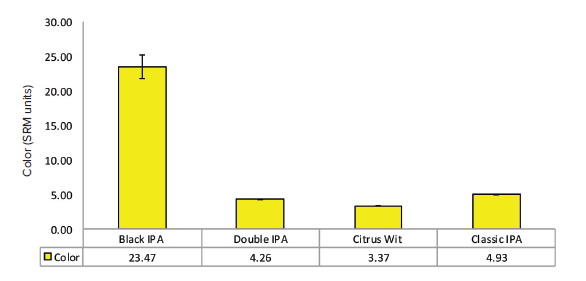
Figure 1. Beer color analysis. Beer samples were aliquoted into a plastic cuvette for color analysis on the QuickDrop (n = 4).
The QuickDrop was also able to measure sample bitterness. Bitterness contributes to one of beer’s most defining characteristics – taste3. In Figure 2, we isolated and measured the bitter compounds of beer by utilizing a liquid-liquid extraction process. Results were reported in international bitterness units (IBUs), and they roughly correspond with the expected bitterness profiles of the beers. The double IPA’s bitterness levels were lower than expected.
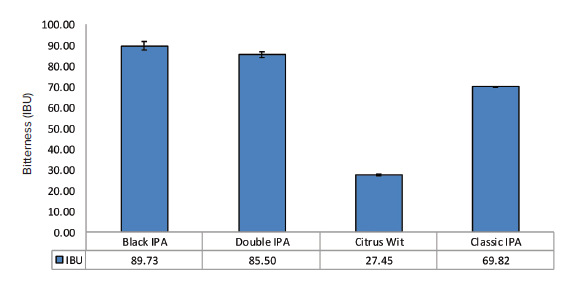
Figure 2. Beer bitterness analysis. Bitterness of the samples was measured according to the protocol in the Methods section. Bitterness was calculated by multiplying the A275 values by 50 (n = 3).
The last characteristic tested was the free-amino nitrogen (FAN) levels. FAN comprises all the amino acids and peptides present in the wort, the nutrient-rich liquid to be fermented by yeast4. Depending on when it is measured, FAN levels can be used to measure yeast metabolism or to determine when beer fermentation is complete. In Figure 3, we utilized the ninhydrin-based procedure from the ASBC and measured FAN levels in the beer samples.
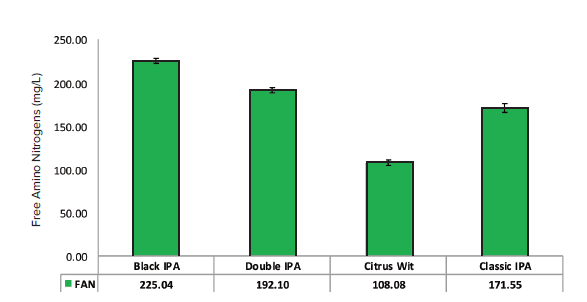
Figure 3. Free Amino Nitrogen analysis. FAN levels were measured using the protocol described in the methods section (n = 3).
Conclusion
The techniques and results were reviewed by the brewing company, and the results agreed very closely with their own analyses.
Additionally, the QuickDrop’s equation editor can be used to create custom protocols to automatically calculate complex equations. For example, a protocol could be set up to calculate FAN levels based on equation 1 (Figure 4).
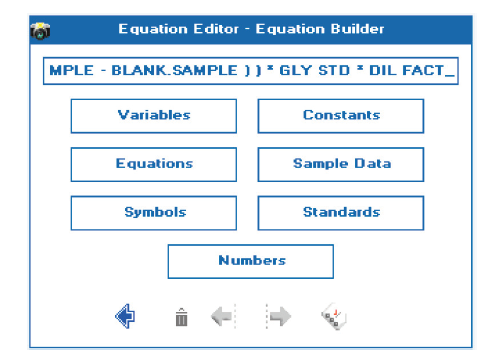
Figure 4. Equation editor screen. The QuickDrop’s equation editor can create and store protocols to automatically calculate and report results for complicated experiments.
We chose to highlight some of the common experiments performed in the breweries, but there are many different tests that can be performed on the QuickDrop to assess beer quality. With its wide spectral range and intuitive software, the QuickDrop is well-suited for characterizing beer.
Sources
- Damerow, Peter. “Sumerian beer: the origins of brewing technology in ancient Mesopotamia.” Cuneiform Digital Library Journal 2 (2012): 1-20.
- ASBC Methods of Analysis, online. Beer Method 10. Color. Approved (1958). American Society of Brewing Chemists, St. Paul, MN, U.S.A. doi: 10.1094/ASBCMethod-Beer10
- ASBC Methods of Analysis, online. Beer Method 23. Beer Bitterness. Approved (1968), rev. (1975). American Society of Brewing Chemists, St. Paul, MN, U.S.A. doi: 10.1094/ASBCMethod-Beer23
- ASBC Methods of Analysis, online. Beer Method 31. Free Amino Nitrogen (International Method). Approved (1975). American Society of Brewing Chemists, St. Paul, MN, U.S.A. doi: 10.1094/ASBCMethod-Beer31