
Application Note
Measuring reactive oxygen species with SpectraMax microplate readers
- Streamlined workflow enables detection of H2O2 in enzymatic reactions and cell culture
- ROS assay can be multiplexed with other assays for more comprehensive cellular analysis
- Optimization wizards ensure optimal signal detection
Introduction
Reactive Oxygen Species (ROS) are chemically reactive molecules containing oxygen. In eukaryotes, these molecules are mainly created during aerobic respiration and can cause problems, such as DNA damage and lipid peroxidation, resulting in cellular damage. ROS are also involved in apoptosis, cellular aging, and cell signaling1, 2. Naturally, cells protect themselves from these oxidative species with reducing enzymes and antioxidants, but as cells accumulate more ROS than can be processed, cells will shift towards a state of oxidative stress. Thus, the accurate measurement of cellular ROS levels is very important to understanding the roles ROS play in cellular biology and overall physiology.
Some of the most commonly studied ROS are superoxide (O2 - ), hydroxyl radicals (·OH), and hydrogen peroxide (H2O2), which are produced as metabolic byproducts in the cell membrane, mitochondria, and other organelles3 . H2O2 is commonly measured in ROS assays due to its long half-life and high cell permeability. Additionally, some of the ROS are converted to H2O2 during detoxification, making it a good indicator of oxidative stress.
In this application note, we demonstrate how SpectraMax® microplate readers can be used to accurately quantify ROS levels using a luminescence-based assay. The first experiment demonstrates how the readers can be used to measure ROS levels in cells treated with menadione, a synthetic chemical compound which causes futile redox cycling and subsequent ROS accumulation4 . In the second experiment, the luminescent assay is multiplexed with Molecular Devices EarlyTox® Live/Dead Assay Kit to explore the relationship between ROS accumulation and cell viability.
Materials
- HepG2 cells (ATCC cat. #HB-8065)
- Complete growth media
- Minimum Essential Medium (Corning cat. #15-010)
- Fetal bovine serum (Gemini cat. #100-106)
- Penicillin/streptomycin antibiotic (Thermo Fisher Scientific cat. #15140-122)
- Test compounds
- Saponin (Sigma cat. #47036-50G-F)
- Menadione (Sigma cat. #M5625)
- Microplates
- 96-well white-walled clear-bottom tissue-culture treated microplate (Corning cat. #3610)
- 96-well solid white microplate (Greiner cat. #6550)
- 96-well black-walled clear-bottom tissue-culture treated microplate (Corning cat. #3904)
- ROS-Glo H 2 O 2 Assay (Promega cat. #G8820)
- EarlyTox Live/Dead Assay Kit (Molecular Devices cat. #R8340)
- SpectraMax i3x Multi-Mode Microplate Reader (Molecular Devices cat. #i3x)
- SpectraMax L Microplate Reader (Molecular Devices cat. #SpectraMax L Config)
Methods
HepG2 cells were plated into a 96-well clear-bottom, white-walled plate at 10,000 cells/well and incubated at 37°C overnight. The test compound menadione was added to cells in a 1:3 dilution series starting at 330 µM, along with 25 µM ROS-Glo H2O2 substrate. Cells were then incubated at 37°C for two hours. Afterwards, an equal volume of ROS-Glo Detection Solution was added to the treated wells, and the plate was incubated at room temperature for 20 minutes. Luminescence was read on the SpectraMax i3x reader and the SpectraMax L reader. Data were analyzed with SoftMax® Pro Software and graphed using a 4-parameter curve fit.
In the second assay, HepG2 cells were plated into a 96-well clear-bottom, blackwalled plate at 10,000 cells/well and incubated overnight at 37°C. Cells were then treated with 0.25 µM menadione or 0.2% saponin (diluted in 1x PBS). 20 µL of 25 µM ROS-Glo H2O2 substrate was added to the cells at the time of the test compound addition. After two hours of incubation, 50 µL of the treated cell culture media from each well was transferred to a solid white 96-well plate containing 50 µL of ROS-Glo Detection Solution. The plate was incubated for 20 minutes before the luminescence was measured on the SpectraMax i3x reader. In the original plate containing cells, 50 µL of EarlyTox Live/Dead working solution was added, and cells were incubated at room temperature for 30 minutes. The plate was then read on the SpectraMax i3x reader using the fluorescence settings indicated in the EarlyTox Live/Dead Assay Kit product insert (a preconfigured protocol is available in SoftMax Pro Software). Data analysis and graphing were performed in GraphPad Prism.
Results
Menadione is known to interrupt the mitochondrial electron transport chain, causing ROS accumulation. Menadionetreated HepG2 cells showed a concentration-dependent increase in ROS indicated by increased luminescence (Figure 1). The SpectraMax i3x and SpectraMax L readers were used to measure luminescence in these samples and yielded similar data with calculated EC50 values of 13.0 µM and 11.9 µM, respectively.
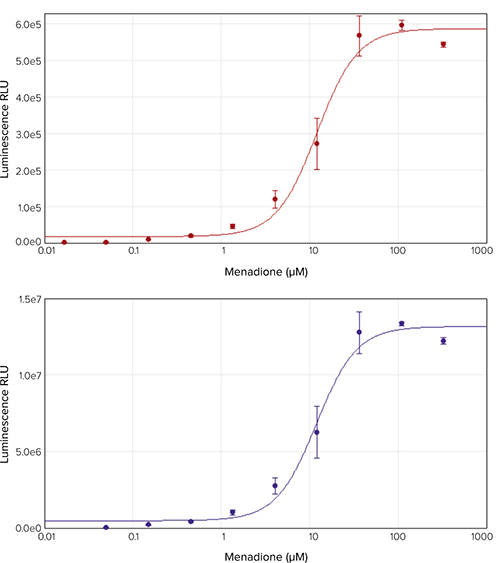
Figure 1. Menadione dose-response curve. HepG2 cells were treated with a 3-fold dilution series of menadione starting at 330 µM and ROS levels were measured using the ROS-Glo H2O2 assay. Luminescence was measured on the SpectraMax i3x reader (top) and on the SpectraMax L reader (bottom). Calculated EC50 values were 13.0 µM and 11.9 µM, respectively.
By assaying for cell viability alongside ROS accumulation, one can better understand the effects of ROS-producing compounds. The ROS-Glo H2O2 assay was multiplexed with the EarlyTox Live/Dead Assay Kit to analyze both ROS generation and cell viability in the same assay wells. Menadione-treated cells produced high levels of ROS but still maintained high cell viability. In contrast, the saponintreated wells produced very little ROS but exhibited very low cell viability (Figure 2).
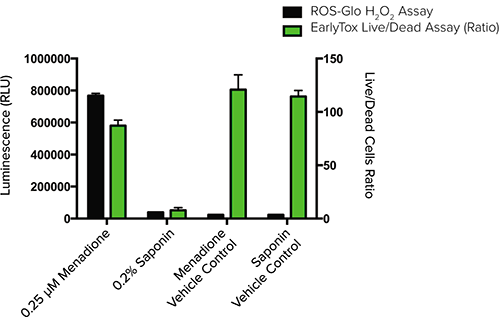
Figure 2. Multiplexed ROS-Glo H2O2 assay with EarlyTox Live/Dead Assay Kit. HepG2 cells were treated with either menadione or saponin and assayed for ROS concentration (luminescence) and cell viability (fluorescence). Cell viability was measured using the EarlyTox Live/Dead Assay Kit and is represented by the ratio of live-to-dead cells. Lower ratios mean higher cell death and lower cell viability.
Conclusion
SpectraMax i3x and SpectraMax L readers enable accurate ROS measurement with the ROS-Glo H2O2 assay. Additionally, the SpectraMax i3x reader’s multi-mode capability enables multiplexing of assays, providing more data per well. Multiplexing the ROS assay with the EarlyTox Live/Dead Assay revealed that cells treated with menadione exhibited high levels of ROS but did not display dramatic cell death compared to cells treated with saponin. By combining these assays, the relationship between cytoxicity and ROS accumulation can be further explored. SoftMax Pro Software was used to perform data analysis and 4-parameter curve fitting. Microplate and read height optimization wizards ensure optimal signal detection.
References
- Hancock, J. T., R. Desikan, and S. J. Neill. “Role of reactive oxygen species in cell signalling pathways.” Biochemical Society Transactions 29.2 (2001): 345-349.
- Lee, J., N. Koo, and D. B. Min. “Reactive oxygen species, aging, and antioxidative nutraceuticals.” Comprehensive reviews in food science and food safety 3.1 (2004): 21-33.
- Turrens, Julio F. “Mitochondrial formation of reactive oxygen species.” The Journal of physiology 552.2 (2003): 335-344
- Criddle, David N., et al. “Menadione-induced reactive oxygen species generation via redox cycling promotes apoptosis of murine pancreatic acinar cells.” Journal of Biological Chemistry 281.52 (2006): 40485-40492.
Learn more about SpectraMax i3x Multi-Mode Detection Platform >>