
Application Note
3D Imaging of Cancer Cell Spheroids
- Monitor cell health kinetics under environmental control for hours or days
- Reconstruct 3D spheroids with rapid z-stack imaging
- Study spheroids with readily available plates and straightforward imaging workflow
Introduction
Many cancer cell lines will form spheroids if cultured on a favorable three dimensional (3D) matrix. These spheroids are believed to represent tumor physiology more closely than cells plated to grow on a flat surface. With the ability to uniformly grow spheroids in a microplate format such as the Cellable Oncology microplate (Toyo Gosei Co., Ltd.), anti-cancer drugs can be screened for efficacy in a high throughput manner with high content assays on the automated ImageXpress® Micro Widefield High Content Imaging System. MetaXpress® High Content Image Acquisition and Analysis Software can then be used to analyze spheroid images using standard application modules for measurement of live vs. dead cells, evaluation of cell health, or quantitation of proliferation.
Spheroid formation with Cell-able Oncology Microplates
Using the 3D surface present in the Cell-able Oncology Microplate, cancer cells plated onto the 100 µm diameter extracellular matrix (ECM)-coated areas will proliferate and form spheroids of uniform size, which assists in providing more reproducible and valid responses to drug treatment. Because spheroids are attached to ECM on the wellbottom’s surface, they are also better suited for immunofluorescence and immunocytochemistry. Hundreds of spheroids per well, grown in a 96- or 384- well plate format, can be rapidly imaged by acquiring images in multiple z planes through the spheroid and then collapsing the stack of images into a single best-focus image for analysis, all with a standard instrument configuration (Figure 1).
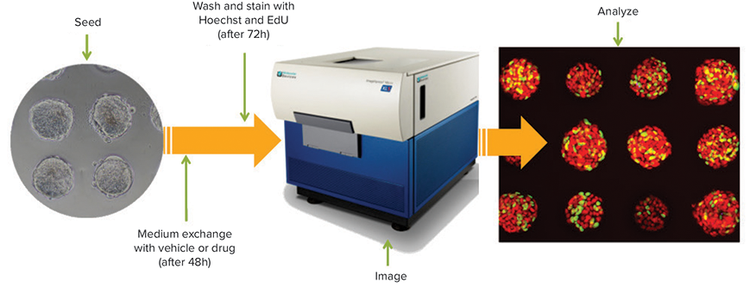
Figure 1. Workflow of 3D spheroid imaging.
Spheroid size influences effective dose of anti-cancer drug
Many cancer cell lines can be used for cytotoxic evaluation of anti-cancer drugs. In this experiment, DU145 human prostate cancer cells were cultured on Cell-able Oncology Microplates at either 10,000 or 30,000 cells per well, then treated with paclitaxel (PTX) for three days at concentrations from 0.1 to 1000 nM. Cell viability was determined using a Live/Dead Cell Viability Assay by staining all nuclei with 10 µM Hoechst 33342, live cells only with 2 µM Calcein AM and dead cell nuclei with 4 µM ethidium homodimer-1 (EthD-1). The plates were incubated for 30 minutes at 37°C, then washed with HBSS before imaging. In both assays, PTX inhibited cell viability in spheroids in a concentrationdependent manner. The larger spheroids, which resulted from plating 30,000 cells per well, were more resistant to PTX cytotoxicity (Figure 2).
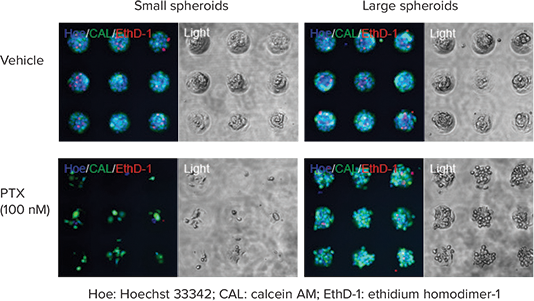
Figure 2. Effective dose of anti-cancer drug influenced by spheroid size. Images of diminished cell viability with fluorescent Live/Dead Cell viability assay after PTX treatment of DU145 human prostate cancer cells plated at 10,000 cells (left) or 30,000 cells per well (right). All nuclei are colored blue, live cells are green, dead cells are red. The transmitted light image shows reduced viability of spheroids at high dose of PTX.
Use time-lapse imaging to monitor apoptosis and necrosis
Cancer spheroids grown on Cell-able Oncology Microplates can be used to screen for induced apoptosis and necrosis by anti-cancer drugs. To monitor this process in real time, spheroids of DU145 human prostate were treated with PTX or carboplatin (CBDCA), and PC9 human lung cancer cells were treated with lapatanib. After addition of CellEvent Caspase-3/7 Green Detection Reagent (CAS) to identify cells in early apoptosis and ethidium homodimer-1 (EthD-1) to measure necrotic cells, the plate was maintained in the environmentally-controlled chamber of the ImageXpress Micro System for 72 hours and imaged every 30 minutes using transmitted light as well as fluorescence. The time-lapse images were then quantified using MetaXpress Software. As expected, both PTX and CBDCA induced apoptosis and necrosis in DU145 cells as did lapatinib in PC9 cells (Figure 3).
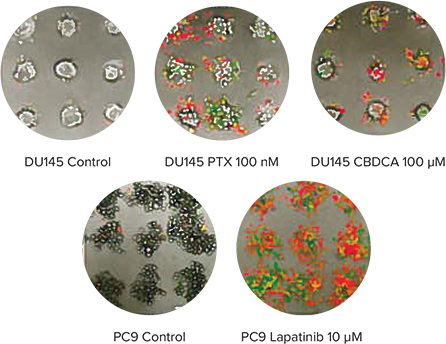
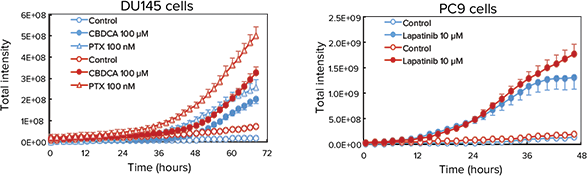
Figure 3. Monitoring apoptosis and necrosis over time. Top: Final images of a three-color timelapse experiment showing apoptosis and necrosis in DU145 spheroids after treatment of PTX or CBDCA (top) and PC9 spheroids after treatment of lapatinib (bottom). Apoptotic cells show as green while necrotic cells are red in the color overlay. Bottom: Quantitative analysis of the time-lapse images indicated CBDCA and PTX slowly induced necrosis (red traces) in DU145 cells (bottom left) while lapatinib induced both necrosis (red) and apoptosis (blue traces) quite readily in PC9 cells (bottom right).
3D spheroids more resistant to compounds than traditionally plated cells
Cells cultured using 2D methods can display different chemosensitivities than those cultured using Cell-able 3D matrix. To monitor these differences in sensitivity, the DU-145 human prostate cancer cell line was cultured using both a traditional 2D microplate matrix and the 3D Cell-able matrix and after two days was treated with 0.3 to 1000 nM gemcitabine. Cells were maintained for 72 hours after drug treatment and then labeled with the Click-iT EdU Cell Proliferation Assay and DAPI for an endpoint measurement. A dose-wise toxic effect, reduced nuclear staining, and reduced EdU uptake, was obvious in both parameters monitored. However, the 3D spheroids were more resistant to the compounds as indicated by a shift in concentration response and significantly higher IC50 values (Figure 4).

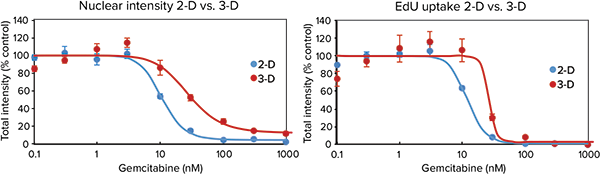
Figure 4. Traditionally plated cells vs. spheroids. Top: Images of both 2D and 3D cultured DU145 cells after 72-hour treatment with gemcitabine followed by staining with Click-iT EdU Cell Proliferation Assay (red) and Hoechst nuclear stain (blue). Spheroid images were acquired with a 10X PFluor objective, two fields per well, and Z-stack of 8 x 5 µm (= 40 µm).Bottom: Dose response was measured via total nuclear staining or EdU uptake. 3D-cultured cells demonstrated toxic response at higher concentrations of compound than 2D plated cells, indicating lower sensitivity to gemcitabine.
Screen drugs with 3D spheroids
The ability of in vitro Cell-able 3D culture systems to produce human cancer cell spheroids of uniform size and the ability to screen spheroid response to treatment using automated high throughput, high content imaging is a significant step in facilitating more relevant testing of chemotherapeutic drug candidates. The ImageXpress Micro System and MetaXpress Software allow rapid imaging and analysis of 3D spheroids in microplates for monitoring induced apoptosis and necrosis and cytotoxicity of anti-cancer drugs, as well as to compare chemosensitivity differences between 2D and 3D cultured cells.
Learn more about ImageXpress Micro XLS Widefield High-Content Analysis System >>