
Application Note
HTRF IP-One Gq assay on SpectraMax Readers
- Assured instrument performance with certified HTRF compatibility
- High sensitivity and wide dynamic range
- Powerful platform for functional assays, suitable for HTS
Caroline Cardonnel | Sr. Applications Scientist | Molecular Devices
Introduction
HTRF® is a versatile technology developed by Cisbio Bioassays for detecting biomolecular interactions1. It combines fluorescence resonance energy transfer (FRET) technology with time-resolved (TR) measurement of fluorescence, allowing elimination of short-lived background fluorescence. The assay uses donor, either europium cryptate (Eu3+) or terbium (Lumi4™-Tb) cryptate, and acceptor fluorophore, either XL665 or the small molecule d2. When donor and acceptor are close enough to each other, excitation of the donor by an energy source (e.g., flash lamp) triggers an energy transfer to the acceptor, which in turn emits specific fluorescence at a given wavelength.
Here, we show how SpectraMax® i3x and SpectraMax® iD5 Multi-Mode Microplate Readers are used to perform Gq-coupled receptor assays using HTRF technology. G-protein coupled receptors signal through two major pathways, regulation of cAMP and increase in intracellular calcium levels mediated by IP3. Cisbio’s IP-One Gq kit offers an alternative to calcium flux assays by enabling detection of the accumulation of inositol monophosphate (IP1), a stable downstream metabolite of IP3 (Figure 1).
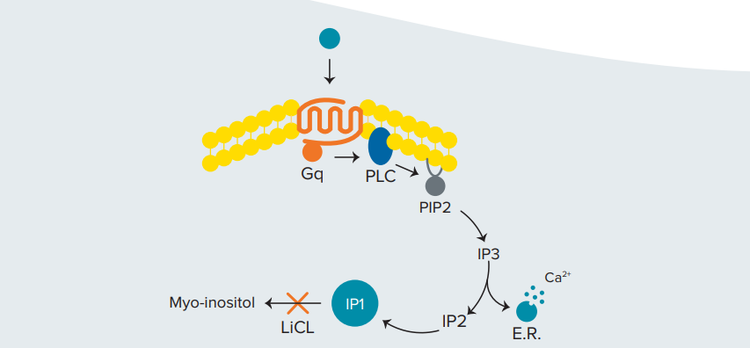
Figure 1. Activation of the Gq pathway. IP1, a downstream metabolite of the second messenger IP3, accumulates in the presence of LiCl
In the presence of lithium chloride (LiCl), the degradation of IP1 is inhibited and accumulates in signaling cells (Figure 1). In the IP-One HTRF assay, IP1 labeled with d2 acceptor competes with native IP1 produced by the cells for binding to an IP1-specific monoclonal antibody labeled with cryptate donor. An increase in production of unlabeled IP1 by the cells results in disruption of TR-FRET and a decrease in the HTRF signal (Figure 2)2. The IP-One assay can be used to characterize compounds that act on Gq-coupled receptors in either adherent or suspension cells.
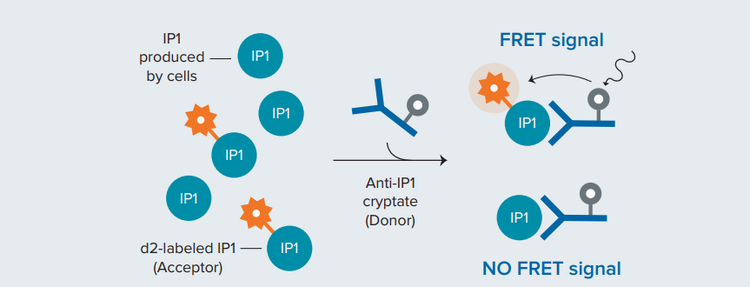
Figure 2. Principle of the HTRF IP-One competitive binding assay. IP1 labeled with d2 acceptor competes with native (unlabeled) IP1 for binding to the donor-labeled IP1-specific monoclonal antibody. An increase in unlabeled IP1 results in disruption of TR-FRET and a decrease in the HTRF signal
Materials
- IP-One Gq kit, 1000 tests (Cisbio cat. #62IPAPEB
- iCell ® Neurons (Cellular Dynamics International)
- SpectraMax i3x Multi-Mode Microplate Reader (Molecular Devices cat. #I3X)
- HTRF Detection Cartridge (Molecular Devices cat. #0200-7011)
- SpectraMax iD5 Multi-Mode Microplate Reader (Molecular Devices cat. #ID5)
- HTRF Detection System (Molecular Devices cat. #6590-0144; includes Enhanced TRF Module, excitation and emission filters)
Methods
IP1 standards with final concentrations ranging from 1.9 nM to 7700 nM were prepared as indicated in the assay product insert3. A positive control without any unlabeled IP1 (maximum FRET) and a negative control without IP1 or anti-IP1-d2 antibody were included. Reagents were dispensed to a final volume of 20 μL per well as indicated in Figure 3. The plate was incubated for one hour at room temperature and read with the SpectraMax i3x and iD5 readers using the optimized settings shown in Table 1.
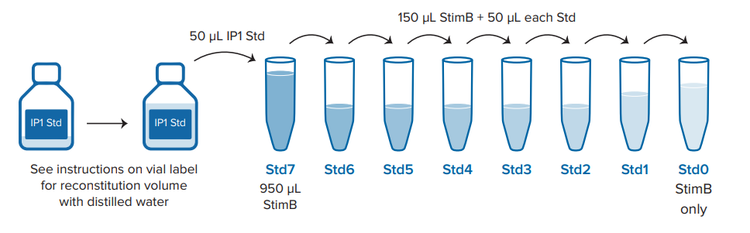
*StimB has to be first diluted with distilled water from 5X to a 1X solution (e.g. 1 volume of StimB 5X + 4 volumes of distilled water)
Figure 3. Assay setup for a 384-well low-volume plate. ‘StimB’ is Stimulation Buffer, included in the IP-One Gq kit.
Donor: 620 nm
Acceptor: 665nm
Donor: 616/10 nm
Acceptor: 665/10 nm
Table 1. Instrument settings for SpectraMax i3x and iD5 readers. These settings were optimized for the IP-One Gq assay and may differ slightly from settings used with other HTRF assays.
To optimize the settings, the delay time, integration time, and the number of pulses were adjusted until the Delta F% (see Data Analysis, below) increased noticeably. The optimized settings listed in Table 1 can be transferred to any plate reader of the same model, i.e. settings listed below for the SpectraMax iD5 reader can be used for any SpectraMax iD5 reader. However, microplate optimization and read height adjustment should be performed any time a new plate type—or lot of plates—or reagent volume is used so that the optics for the reader are aligned to the assay plate. This ensures minimal error, as well as optimal assay sensitivity and dynamic range.
Data analysis
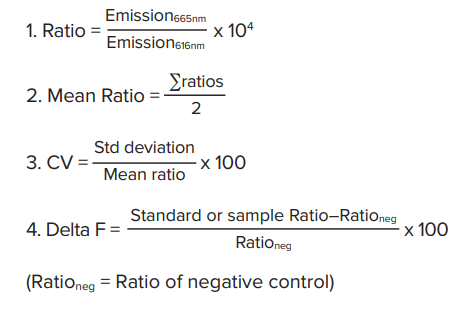
Analysis of HTRF assays uses Cisbio’s patented ratiometric reduction method based on the two emission wavelengths detected. Donor emission at 616 nm is used as an internal reference, while acceptor emission at 665 nm is used as an indicator of the biological reaction being assayed. This ratiometric measurement reduces well to-well variation and eliminates compound interference. Delta F, calculated in step 4 below, reflects signal to background of the assay and is useful for inter-assay comparisons. Results are calculated from the 665 nm/616 nm ratio and expressed in Delta F as follows:
Data were generated and analyzed using SoftMax® Pro Software, which contains preconfigured HTRF protocols to simplify detection and analysis using the method described above.
Results
The standard curves for SpectraMax i3x and iD5 readers were graphed using SoftMax Pro Software and applying a 4-parameter curve fit (Figure 4), with the results summarized in Table 2. The assay suitability was assessed using the EC50, which should be below 150 nM. For both readers, the EC50 values were below 85 nM, well within the acceptable range. Cisbio defines an acceptable signal to noise ratio as ≥ 20, and both readers met this criterion. With these results, as well as CV values below 6% for all standards, both the SpectraMax i3x and the SpectraMax iD5 readers demonstrate high sensitivity and a wide dynamic range for the IP-One assay.
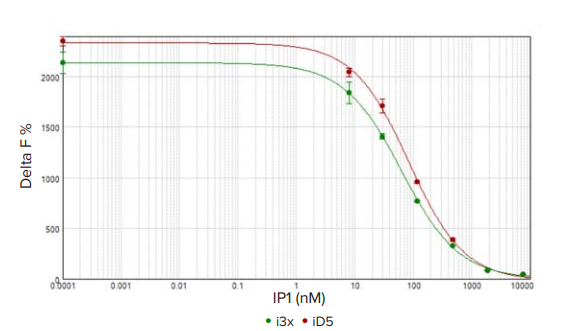
Figure 4. HTRF IP standard curve. HTRF IP1 standard curve measured on the SpectraMax i3x (green circles) and SpectraMax iD5 (red circles) readers. The assay window for the SpectraMax iD5 was somewhat larger but the assay quality was excellent for both readers (CV < 6%).
Table 2. Results summary for HTRF IP1 standard curve.
Conclusion
The SpectraMax i3x and iD5 readers can be equipped with an HTRF-certified detection cartridge or an HTRF-certified detection system, respectively. Both readers demonstrated their ability to detect IP1 concentrations according to Cisbio’s acceptance criteria. Data acquisition and analysis are simplified using SoftMax Pro Software with preconfigured HTRF protocols.
References
- http://www.htrf.com/htrf-technology
- Garbison KE, Heinz BA, Lajiness ME. IP-3/IP-1 Assays. 2012 May 1. In: Sittampalam GS, Grossman A, Brimacombe K, et al., editors. Assay Guidance Manual.
- https://www.cisbio.eu/media/asset/c/i/cisbio\\_dd\\_pi\\_62ipapeb-62ipapec-62ipapej.pdf
Caroline Cardonnel | Sr. Applications Scientist | Molecular Devices
简介
HTRF® 是 Cisbio 公司开发的用于检 测生物分子相互作用的 实验技术 1 。它将荧光共振能量转移 (FRET) 技术与时间分辨 (TR) 荧光技术相结合,可以消除荧光寿命较短的背景荧光。 该检 测方法 使 用铕 (Eu3+) 或 铽 (Lumi4 ™ -Tb) 的穴状 化合 物 作为供体,荧光团 ( XL665 或小分子 d2 ) 作为受体。当供体 和受体距离足够近时,供体被一个能量源激发,可以引发能量 转移到受体,使其在特定波长发出荧光。
在 这 里, 我 们 展 示 了 如 何 使 用 SpectraMax®i3x 和 SpectraMax®iD5 多功能微孔板读板机应用 HTRF 技术进行 Gq- 偶联受体的分析。G 蛋白偶联受体的分析主要通过检测 cAMP 和 IP3 这两条信号转导通路调控介导的细胞内钙离子水 平的升高。Cisbio 公司的 IP-One Gq 试剂盒通过检测 IP3 的 稳定下游代谢产物——磷酸肌醇 (IP1) 的积累,为钙离子检测 提供了一种替代方法 ( 图 1 )。
***图 1 Gq 通路的激活。*IP1 是第二信使 IP3 的下游代谢产物,在 LiCl 存在时积累。
在氯化锂 (LiCl) 存在的情况下,IP1 的降解被抑制并在信号细 胞中积累 ( 图 1 )。在 IP-One HTRF 实验中,带有 d2 受体的 IP1 可以与细 胞 产生的天 然 IP1 竞争,结合带有穴状 化合 物 供体的 IP1 特异性单克隆抗体。细胞产生的未标记 IP1 ( 天然 IP1 ) 的增加会导致 TR-FRET 的中断和 HTRF 信号强度的减弱 ( 图 2 )2 。IP-One 检测可用于表征贴壁细胞或悬浮细胞中作用 于 Gq- 偶联受体的化合物。
***图 2 HTRF IP-One 竞争性结合实验的原理。*d2 受体标记的 IP1 与天然 ( 未标记 ) IP1 竞争,以结合供体标记的 IP1 特异性单克隆抗体。未标记 IP1 的 增加会导致 TR-FRET 的中断和 HTRF 信号的减少。
实验材料
- IP-One Gq 试剂盒 , 1000 次 (Cisbio cat. #62IPAPEB)
- 白色 384 孔微孔板 (Greiner cat. #784075)
- SpectraMax i3x 多功能微孔板读板机 (Molecular Devices cat. #I3X)
- HTRF 检测卡盒 (Molecular Devices cat. #0200-7011)
- SpectraMax iD5 多功能微孔板读板机 (Molecular Devices cat. #ID5)
- HTRF 检测系统 ( Molecular Devices cat. #6590-0144; 包 含增强型 TRF 模块 , 激发和发射滤片 )
方法
如产品使用说明书所示 3 ,IP1 标准品制备的最终浓度范围为 1.9 nM 至 7700 nM。包括一个没有任何未标记 IP1( 最大 FRET ) 的 阳性对照和一个没有 IP1 或抗 IP1-d2 抗体的阴性对照。如图 3 所示,试剂的最终用量为每孔 20 µL。将微孔板在室温下孵育 1 小时,使用 SpectraMax i3x 和 iD5 读板机读取数据,优化设置 如表 1 所示。
*StimB has to be first diluted with distilled water from 5X to a 1X solution (e.g. 1 volume of StimB 5X + 4 volumes of distilled water)
***图 3 384 孔微孔板的测定设置。*IP-One Gq 试剂盒中包含“ StimB”( 刺激缓冲液 )。
Donor: 620 nm
Acceptor: 665nm
Donor: 616/10 nm
Acceptor: 665/10 nm
***表 1 SpectraMax i3x 和 iD5 微孔板读板机的仪器设置。*这些设置针 对 IP-One Gq 的检测进行了优化,可能与其他 HTRF 检测使用的设置略 有不同。
调整延 迟时间,间隔时间和脉冲次数以优化设置,直到△ F % ( 请参见下面的数据分析 ) 显著增加。 并且可以将表 1 中列 出的优化设置应用到同一型号的任何酶标仪上,即下面列出 的 SpectraMax iD5 微孔 板读 板机 的 设 置可以 用于 任 何一台 SpectraMax iD5 读板机。但是,当使用新类型的微孔板 ( 或大 量微孔板 ) 或试剂体积发生改变时,都应执行微孔板优化和读 数高度调整,以使读板机的光学系统对准化验板。 这样可以确 保最小的误差,以及最佳的检测灵敏度和动态范围。
数据分析
HTRF 分析使用 Cisbio 公司的专利比值测定法,该方法基于检 测到的两个发射波长。将供体在 616 nm 处的发射作为内参,受 体在 665 nm 处的发射作为被测生物反应的指示。这种比值测 定方法可以减少孔间误差并消除复合干扰。在下面第 4 步中计 算的 △ F 反映了分析背景的信号,适用于批间分析的比较。根 据 665 nm/616 nm 比值计算得到的结果用 △ F 表示如下 :
使用 SoftMax®Pro 软件生成和分析数据,该软件包含预先配置 的 HTRF 协议,可以简化使用上述方法进行检测和分析的流程。
结果
在 SpectraMax i3x 和 SpectraMax iD5 微 孔 板 读 板 机 上 使 用 SoftMax Pro 软件绘制标准曲线,并进行 4 参数曲线拟合 ( 图 4),结果见表 2。使用 EC50 评估该测定方法的适用性,EC50 值 应低于 150 nM。对于两个 读板机,EC50 值均低于 85 nM,处 于可接受范围内。Cisbio 将可接受的信噪比定义为≥ 20,两 个读板机都满足这个标准。凭借这些结果以及所有标准的 CV 值 均 低 于 6 %, 这 些 实 验 结 果 表 明 利 用 SpectraMax i3x 和 SpectraMax iD5 读板机进行 IP-One 检测具有高灵敏度和宽动 态范围。
图 4 HTRF IP 标 准 曲 线。在 SpectraMax i3x ( 绿 色 ) 和 SpectraMax iD5 ( 红色 ) 读板机上测定的 HTRF IP1 标准曲线。SpectraMax iD5 的 分析窗口稍大,但两种读板机的分析质量都非常好 (CV < 6%)。
表 2 HTRF IP1 标准曲线结果汇总。
结论
SpectraMax i3x 和 iD5 微孔板读板机分别配备 HTRF 认证的检测卡盒或 HTRF 认证的检测系统。根据 Cisbio 的认证标准,两个读板 机都具备检测 IP1 浓度的能力。使用预置 HTRF 协议的 SoftMax Pro 软件可以简化数据采集和分析流程。
参考文献
- http://www.htrf.com/htrf-technology
- Garbison KE, Heinz BA, Lajiness ME. IP-3/IP-1 Assays. 2012 May 1. In: Sittampalam GS, Grossman A, Brimacombe K, et al., editors. Assay Guidance Manual.
- https://www.cisbio.eu/media/asset/c/i/cisbio\\_dd\\_pi\\_62ipapeb-62ipapec-62ipapej.pdf