
Application Note
Measure intracellular reactive oxygen species using far-red fluorescence
- Quickly detect intracellular ROS using one-step, homogeneous, fluorescent assays
- Reduce background noise and improve assay performance with the ultra-cooled PMT feature
- Optimize excitation and emission wavelength combinations using the Spectral Optimization Wizard
Introduction
Hoang Ha | Applications Scientist | Molecular Devices
Reactive oxygen species (ROS) are chemically reactive molecules containing oxygen resulting from aerobic cellular metabolism. These chemical species are involved in cellular processes such as cell signaling, homeostasis, and immunological defense. However, under periods of environmental stress, intracellular ROS levels can dramatically increase and cause oxidative damage to lipids, proteins, and nucleic acids.1 These alterations are linked to a variety of pathological events such as male infertility, carcinogenesis, and many other physiological conditions.2
Fluorescent probes are commonly used to measure intracellular ROS levels, with green fluorescent probes being the most popular. However, detection and imaging in the green fluorescence range can be affected by cellular autofluorescence.3 Alternatively, far-red and near-infrared (NIR) fluorescent dyes can be used to measure ROS levels, avoiding interference from cellular autofluorescence.
The SpectraMax® iD5 Multi-Mode Microplate Reader's patented ultracooled PMT and 4-monochromator optical pathway design reduces signal background and stray light. These characteristics provide wide dynamic range and sensitivity for far-red fluorescent assays.
Here, we demonstrate how the SpectraMax iD5 reader can be used to measure intracellular ROS levels using two fluorimetric assay kits. Using the Spectral Optimization Wizard, we optimized the excitation and emission wavelength combinations for the far-red assay. Finally, we compared assay performance between the green fluorimetric assay and the far-red fluorimetric assay
Materials
- Cell Meter ™ Fluorimetric Intracellular Total ROS Activity Assay Kit *Deep Red Fluorescence* (AAT Bioquest cat. #22903)
- Cell Meter ™ Fluorimetric Intracellular Total ROS Activity Assay Kit *Green Fluorescence* (AAT Bioquest cat. #22900)
- HEK293 cells (AATC cat. #CRL-1573)
- Menadione (Sigma cat. #M9429-25G)
- 96-well tissue culture-treated, clear bottom, black-walled plates (Greiner cat. #655087)
- SpectraMax iD5 Multi-Mode Microplate Reader (Molecular Devices cat. #iD5)
Methods
HEK293 cells were plated into several 96-well cell culture-treated microplates at 10,000 cells per well, and the cells were allowed to recover in a 37°C incubator for 24 hours. Afterwards, cells were treated with a 2-fold dilution series of menadione starting at 25 µM for 1 hour. Following treatment, either the Cell Meter Deep Red ROS detection reagent or the Cell Meter Green Fluorescence ROS detection reagent was added to the cells, and the plates were incubated at 37°C for 30 minutes.
The Cell Meter Deep Red ROS assay’s recommended wavelength pair (658/675) was incompatible with the SpectraMax iD5 reader because of the proximity between the excitation and emission wavelengths. In this experiment, we estimated the 625/700 wavelength pair so there would be sufficient distance between the excitation and emission monochromator bandwidths while still producing ample fluorescence signal (Figure 1).
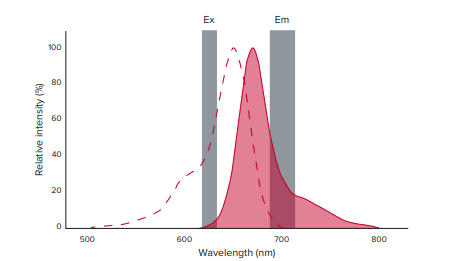
Figure 1. Far-red fluorescence spectrum. The excitation and emission spectra for the Cell Meter Deep Red ROS assay are shown above. The dotted red line represents the excitation spectrum with a peak at 650 nm, and the solid red line represents the emission spectrum with a peak at 675 nm. The shaded gray bars represent the selected, non-optimized wavelength pair used to perform the assay, and their associated monochromator bandwidths of 15 nm (excitation) and 25 nm (emission).
SoftMax® Pro Software’s Spectral Optimization Wizard was used to automatically calculate the optimal excitation and emission wavelength pair for the far-red assay. Additionally, the “Read Height Optimization” setting was used to determine the optimal read height for the assay. Wavelengths and PMT gain used in the experiments are shown in Table 1. Data and graphs were generated using SoftMax Pro Software.
Table 1. Wavelength and PMT settings for the assay.
Results
Menadione causes cellular ROS accumulation by interrupting various parts of the mitochondrial electron transport chain4 , so we expected an increase in intracellular ROS levels with increasing menadione concentrations. Both the green fluorescent and far-red fluorescent assay kits generated menadione dose-response curves with similar EC50 values (Figures 2 and 3). The Spectral Optimization Wizard’s wavelength combination for the far-red assay provided the best Z' factor (Table 2).
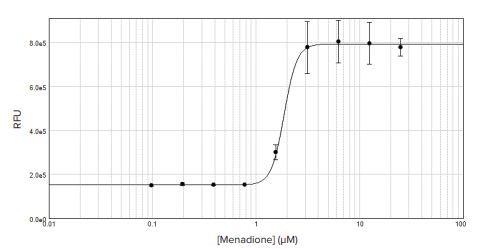
Figure 2. Green fluorescence intracellular ROS measurement. Menadione-treated HEK293 cells were assayed using the Cell Meter Green Fluorescence Intracellular ROS assay, and the 4-parameter dose-response curve was generated in SoftMax Pro Software. An EC50 of 1.86 µM was calculated from the data.
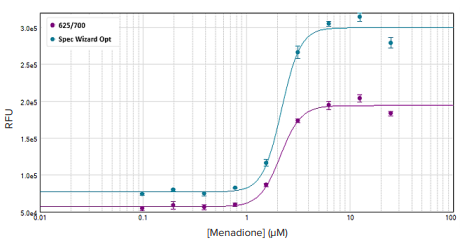
Figure 3. Far-red fluorescence intracellular ROS measurement. The Spectral Optimization Wizard's determined wavelength pair (light blue) produced the larger assay window compared to the userestimated wavelength pair. EC50 values of 2.10 µM and 2.21 µM were calculated from the spectrally optimized wavelength pair and user-estimated pair respectively
EC
50
(µM)
Table 2. Dose response and Z factor table for Cell Meter far-red assay. EC50 values calculated from each assay were similar and each assay demonstrated a Z factor well above 0.5, indicating a robust assay.
Conclusion
The SpectraMax iD5 Multi-Mode Microplate Reader, combined with SoftMax Pro Software, is an excellent tool for fluorometrically measuring intracellular ROS levels. The Spectral Optimization Wizard and read height optimization features in SoftMax Pro Software automatically optimize assay conditions for best results. Although the SpectraMax iD5 reader was able to effectively detect both assays, the far-red assay with optimized excitation and emission wavelengths demonstrated slightly better Z' factors than the green fluorescence-based assay.
References
- Hancock, J. T., R. Desikan, and S. J. Neill. "Role of reactive oxygen species in cell signalling pathways. "Biochem Soc Trans. (2001) May; 29 (Pt 2): 345-50
- Ogawa K, Suzuki K, Okutsu M, Yamazaki K, Shinkai S. The association of elevated reactive oxygen species levels from neutrophils with low-grade inflammation in the elderly. Immunity & Ageing: I & A. 2008; 5:13. doi: 10.1186/1742-4933-5-13.
- Lin, Michael Z. "Beyond the rainbow: new fluorescent proteins brighten the infrared scene. "Nature Methods 8.9 (2011): 726.
- Kolesova, G. M., L. V. Karnaukhova, and L. S. Iaguzhinskiĭ. "Interaction of menadione and duroquinone with Q-cycle during DTdiaphorase function. "Biokhimiia (Moscow, Russia) 56.10 (1991): 1779-1786.