
Application Note
Optimization of a muscarinic M3-receptor assay using frozen CHO cells on the FlexStation 3 reader
- Versatile assay offers broad applicability across a range of biological targets
- Homogeneous format reduces plate handling and provides higher throughput
- Multi-channel liquid handling enables easy setup of both agonist and antagonist studies
Introduction
Cell-based assays can often be challenging and time consuming. To facilitate and streamline this complicated process, frozen cells, which can be assayed without prior cultivation, have become a suitable and frequently used alternative to cells in continuously growing culture. Frozen cells decouple cell culture preparation from functional testing, can help alleviate biological variability, improve plate-to-plate consistency and data fidelity, increase the flexibility of assay scheduling and significantly decrease cell culture costs.
The FLIPR®Calcium 5 Assay Kit(Figure 1), exhibits superior performance to other “no wash” calcium reagents, and has broad applicability across a varied selection of biological targets. Elimination of the usual wash steps has the key advantage of reduced plate handling and faster assay throughput. In addition, under suboptimal assay conditions, the use of a homogenous assay has the potential for enhancements in data quality and reduced well-to-well variability.
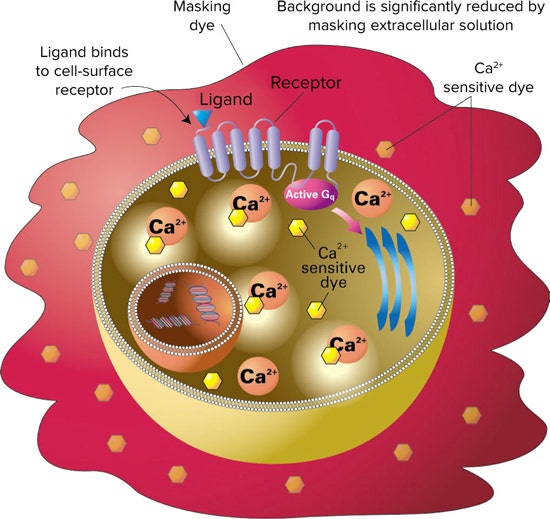
Figure 1. FLIPR Calcium Assay principle. FLIPR Calcium Assay Kits include a calcium sensitive dye that is taken into the cytoplasm of the cell during incubation. The kit’s masking dye remains outside the cell and blocks background fluorescence. Upon ligand binding to the receptor, calcium is released into the cytoplasm of the cell. The dye binds to the intracellular calcium and becomes fluorescent.
The FlexStation®3 Multi-Mode Microplate Reader offers added flexibility over dispenser-based systems by directly transferring reagents from a source plate to the read plate, which reduces reagent and consumable consumption. The ability to define individual reagents and concentrations to be delivered to each column on the cell plate allows more assay conditions to be explored in a single experiment, and makes the system ideal for both agonist and antagonist studies.
In this application note, we utilize the FlexStation 3reader to compare different Ca2+indicators (both single-wavelength and dual-wavelength) in a representative Gq-GPCR assay to highlight the potential benefits of using a homogeneous ‘no wash’ calcium reagent. In addition, we compare assay performance and data fidelity between cells in continual culture and those prepared from frozen reagent (“Assay Ready” cells available from the European Collection of Cell Cultures (ECACC)).
Materials
- FlexStation 3 Multi-Mode Microplate Reader (Molecular Devices)
- AquaMax ® 4000 Microplate Washer fitted with the 96-well cell wash head (Molecular Devices)
- ImageXpress ® Micro Widefield High Content Screening System (Molecular Devices)
- FLIPR Calcium 5 Assay Explorer Kit (Molecular Devices, Cat. #R8185)
- Fluo-4 AM (Invitrogen, Cat. #F-14201)
- Fura-2 AM (Invitrogen, Cat. #F-1221)
- DAPI Nucleic Acid Stain (Invitrogen, Cat. #D-1306)
- Cryopreserved “Assay Ready” CHO cells expressing the human muscarinic M 3 receptor (CHRM3, ECACC, Cat. #10031603)
- Water soluble probenecid (Invitrogen, Cat. #P-36400)
- Growth media for CHO cells: Hams F12: DMEM with 10% FBS and 1% pen/strep (Invitrogen, Cat. #31331-093, 16140-071 and 15140-122)
- Hanks Balanced Salt Solution (HBSS) with calcium and magnesium with 20 mM HEPES (Invitrogen, Cat. #14025-050 and 15630-056)
- Cell plates (black-wall, clear-bottom 96-well CellBIND microplates, Corning, Cat. #3340)
- Acetylcholine, non-selective muscarinic receptor agonist (ACh, Sigma, Cat. #A6500)
- p-Fluorohexahydro-sila-difenidol hydrochloride, muscarinic receptor antagonist (p-F-HHSiD, Sigma, Cat. #H127)
- Methanol (Sigma, Cat. #179337)
Methods
Cell handling and plating methods
- CHO cells expressing the muscarinic M 3 receptor (CHRM3) kept in continual culture were plated at 30,000 cells/ well in 200 µL growth media, left to settle on the bench for 30 min. at room temperature then maintained overnight at 37°C, 95% humidity and 5% CO 2 .
- “Assay-Ready” frozen CHRM3 cells were thawed rapidly in a 37°C water bath, pipetted gently into 10 mL of warm growth media and centrifuged for 5 min. at 1000 rpm. Cells were resuspended in culture media and plated out at 50,000 cells/well in 200 µL media, plates were left on the bench for 30 min. at room temperature prior to being incubated at 37°C, 95% humidity and 5% CO 2 for 18 hours.
- Cryopreserved CHRM3 cells were thawed rapidly in a 37°C water-bath, pipetted gently into 10 mL warm growth media and centrifuged for 5 min. at 1000 rpm. Cells were resuspended in 10 mL warm growth media before being returned to the CO 2 incubator for 60 min. Following centrifugation the cells were resuspended in FLIPR Calcium 5 Assay reagent and plated out at 75,000 cells/ well in 100 µL of loading buffer. Finally, cell plates were centrifuged again at 1000 rpm (with no brake) before being returned to the CO 2 incubator for 45 min.
FLIPR Calcium 5 Assay reagent loading
Dye loading buffer was prepared by dissolving the contents of one vial of dye completely with a final volume of 20 mL Hanks Balanced Salt Solution, 20 mM HEPES, 2.5 mM probenecid adjusted to pH 7.4. Cell plates generated using cell preparation methods (1) and (2) were removed from the incubator, growth media was removed and 100 µL dye loading buffer was added to each well. Dye loaded plates were incubated for 45 min. at 37°C, 5% CO2and allowed to equilibrate to room temperature for 15 min. prior to assaying. Plates were not washed after dye loading and the initial assay volume was 100 µL per well.
Fluo-4 AM and Fura-2 AM dye loading
Cells prepared according to method (2) above were incubated with either 100 µL/well Fluo-4 AM or Fura-2 AM (2.5 µM with 2.5 mM probenecid) for 45 min. at 37°C following growth media aspiration. Cell plates were then washed with HBSS buffer plus 2.5 mM probenecid using an AquaMax 4000 Microplate Washer fitted with the 96-well cell wash head. Wash programs consisted of a series of programmed aspirate and dispense steps (Table 1).
Table 1. AquaMax 4000 Microplate Washer parameters for calcium flux assays using CHRM3 cells.
Cell number confirmation on the ImageXpress Micro system
To validate cell number and confluence for the dye comparison tests, plates prepared using cell method (2) above were stained with DAPI nucleic acid stain and imaged on the ImageXpress Micro Widefield High Content Screening System. Briefly, cells were prepared at varying densities and incubated at 37°C, 95% humidity and 5% CO2for 18 hours. Growth media was removed and replaced with 100 µL per well of ice cold methanol. After 5 minutes the methanol was removed and replaced with 100 µL per well DAPI solution (300 nM), this was incubated for 5 minutes before rinsing three times with HBSS. The cell monolayer was then imaged using a 4X objective to measure the entire well area before using the Count Nuclei Application Module for MetaXpress®Software to report total cell number per well.
Cell optimization assays
To compare the three different cell handling methods, Acetylcholine (ACh) agonist response curves and p-F-HHSiD antagonist inhibition curves were compared both qualitatively and quantitatively. After dye incubation and temperature equilibration the calcium mobilization assays were carried out at room temperature. A dilution series of Acetylcholine (ACh) was prepared at 3X final concentrations (assay concentrations 0.03 nM–300 nM) in HBSS buffer in 96-well polypropylene plates, 50 µL/well was added to each well of the cell plates to stimulate intracellular Ca2+release.
For the antagonist studies, p-F-HHSiD was prepared at 3X concentrations and added offline 15 min. prior to addition of 50 µL of a 4X concentration of ACh (EC80).
Fluorescence measurements were taken for 90 seconds before, during, and after compound addition.
Calcium indicator comparison assays
Calcium flux was measured with the FlexStation 3 reader using the ‘Flex’ read mode. Cells loaded with FLIPR Calcium 5 Assay Kit, Fluo-4 AM or Fura-2 AM were challenged with varying concentrations of ACh (20 pM to 8 µM in 5-fold dilutions) using the FlexStation 3 reader’s integrated 8-channel pipettor. Fluorescence measurements were taken for 90 seconds before, during, and after compound addition using optimized parameters (Table 2).
Table 2. Optimized SoftMax Pro Software settings for calcium dye comparison assays in CHRM3 cells on the FlexStation 3 reader.
For the antagonist studies, p-F-HHSiD was added manually to appropriate wells and allowed to equilibrate for 15 minutes prior to placing the plates in the FlexStation 3 reader. The instruments’ on-board fluidic system was then used to dispense 50 µL/well of ACh (EC80concentration) whilst changes in fluorescence were monitored in real time.
Data analysis
Responses were measured as peak fluorescence intensity (FLIPR Calcium 5 Assay Kit or Fluo-4 AM) or the maximal 340/380 nm ratio for Fura-2 AM. To enable easy comparison, data were normalized as % response over baseline and expressed as mean ± s.e.m with n ≥ 4.
Individual sets of concentration-effect curve data were fitted to a four-parameter logistic of the form:
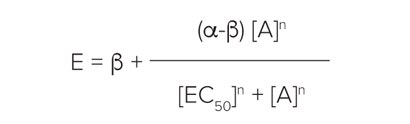
where α, β, EC50and n are the upper asymptote, lower asymptote, location (EC50/ IC50) and slope parameters respectively. All curve-fitting routines were carried out using SoftMax Pro 6 Software.
Z´ factors were calculated using the formula:

where σc+denotes standard deviation of the positive control and σc-represents standard deviation of the negative control. The term | µc+– µc-| denotes the absolute value of the difference between the mean of the positive control signal and the mean of the negative control signal. A Z’ factor > 0.5 indicates a large separation band between the negative and positive controls, and therefore, a robust assay.1
Results
Cell optimization assays
CHRM3 cells2loaded with the FLIPR Calcium 5 Assay Kit showed robust fluorescence increases in response to ACh application (Figure 2) under all three cell preparation methods.
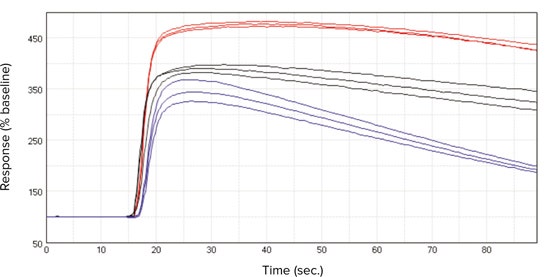
***Figure 2. Kinetic traces.*Representative kinetic traces exported from SoftMax Pro 6 Software for ACh (300 nM) in FLIPR Calcium 5 Assay Kit loaded CHRM3 cells on the FlexStation 3 reader. Cell conditions shown were (•) cells in continual culture, (•) frozen cells used 18 hours after thawing or (•) cells used from frozen. Plot shows % response over baseline on the y-axis against time in sec. on the x-axis.
The calculated EC50values for ACh were within 0.5 log units of each other (Table 3), however there was a significant (P < 0.05) dextral shift in the EC50values when using cells directly from frozen (Figure 3). Likewise, IC50 estimates for p-F-HHSiD were similar between the three cell preparation methods. Z’ estimates were greater for cells in continual culture and frozen cells used 18 hours than those obtained when using frozen cells directly.
EC
50
/IC
50
EC
50
/IC
50
EC
50
/IC
50
1.9 x 10
-9
M
2.5 x 10
-9
M
6.3 x 10
-9
M
p
-F-HHSiD
3.6 x 10
-8
M
3.7 x 10
-8
M
4.9 x 10
-9
M
Table 3. Comparative results for FLIPR Calcium 5 Assay Kit loaded CHRM3 cells under the three different cell handling conditions.*
* Note, the Z’ estimate for the agonist data was calculated using the EC80response. The % response over baseline (% R/B) parameter was obtained by calculating the peak response above baseline, with the baseline set as the 100% response.
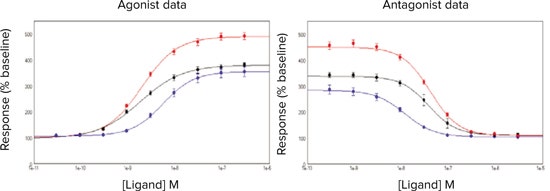
***Figure 3. Activation/inhibition curves.*Activation/Inhibition curves for ACh ± p-F-HHSiD in FLIPR Calcium 5 Assay Kit loaded CHRM3 cells. Cell conditions tested were (•) cells in continual culture, (•) frozen cells used 18 hours after thawing or (•) cells used from frozen.
On the basis of the EC50estimates, greater signal magnitude and improved Z’ values from these initial studies, the easier cell preparation and lower consumable costs, all subsequent experiments were carried out with frozen cells used 18 hours after plating (method 2).
Cell number confirmation on the ImageXpress Micro system
To empirically verify cell number and confluence, two representative cell plates were prepared according to cell preparation method (2). The following day, they were stained with DAPI nucleic acid stain. The plates were then imaged on the ImageXpress Micro Widefield High Content Screening System (Figure 4).
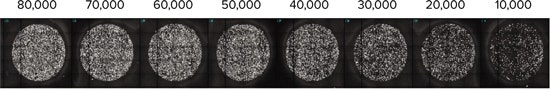
***Figure 4. Cell density.*Representative cell density images taken on the ImageXpress Micro Widefield High Content Screening System. The original cell plating densities are indicated numerically above each representative well.
The optimal cell density giving a consistent monolayer was determined to be 50,000 cells/well in this series of experiments (Table 4). This cell density was then used for all subsequent experiments.
***Table 4. Cell density results obtained with DAPI stained CHRM3 cells.*Data was analyzed using the Count Nuclei Application Module for MetaXpress Software.
Calcium indicator comparison assays
ACh produced a concentration-dependent increase in intracellular Ca2+in CHRM3 cells for cells loaded with the FLIPR Calcium 5 Assay Kit, Fura-2 AM and Fluo-4 AM respectively (Figure 5).
One-way Analysis of Variance (ANOVA) indicated that the EC50estimates for the Fluo-4 AM and Fura-2 AM data sets were not significantly different from one another (P value=0.92).
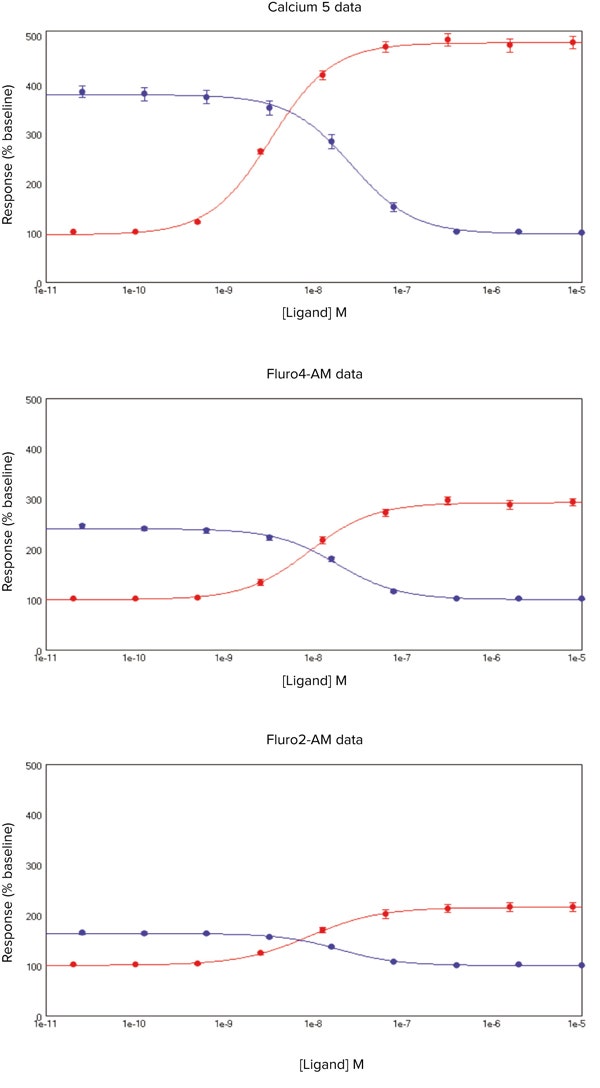
***Figure 5. Calcium 5 Assay Kit data.*SoftMax 6 Pro Software plots showing ACh (•) or p-F-HHSiD (•) concentration (x-axis) against the % change in signal (y-axis) for cells loaded with FLIPR Calcium 5 Assay Kit, Fluo-4 AM and Fura-2 AM. Data is mean ± s.e.m.
However, with the FLIPR Calcium 5 Assay Kit there was a significant (P < 0.05) leftward shift of the EC50values, higher Z’ values and greater response/baseline values (Table 5) suggesting this ‘no-wash’ approach is more optimal.
In comparison, the p-F-HHSiD data suggest that there was negligible difference between the calculated pIC50 values, suggesting that antagonist binding is not significantly affected by the different assay preparation methods (Table 5).
The screening coefficient window (Z’ factor), which reflects the dynamic range of the signal and the data variation for the assay, was calculated using the buffer addition (negative control) and the EC80 concentration of ACh (agonist positive control). Z´ factors obtained with all three dyes were > 0.5 (Table 5). This shows a large separation band between the negative and positive controls and reproducible, high quality assays. However, the FLIPR Calcium 5 Assay Kit data consistently yielded higher Z’ values than the other 2 calcium indicators, and significantly larger responses (% R/B).
EC
50
/IC
50
EC
50
/IC
50
EC
50
/IC
50
3.1 x 10
-9
M
7.9 x 10
-9
M
3.7 x 10
-9
M
p
-F-HHSiD
2.3 x 10
-8
M
2.0 x 10
-8
M
2.1 x 10
-9
M
Table 5. FlexStation 3 reader results for CHRM3 cells loaded with the three different calcium indicators (n ≥ 6).
Conclusion
The FlexStation 3 reader in combination with the FLIPR Calcium 5 Assay Kit has been shown to optimally measure changes in intracellular Ca2+in “Assay Ready” frozen CHO cells expressing the muscarinic M3receptor. The dual monochromators facilitate optimal excitation and emission wavelengths selection, and allow both single-wavelength and dual-wavelength ratiometric indicators to be used.
The recent emergence of frozen cells as viable assay reagents has further streamlined the assay development and screening processes, and we have successfully demonstrated the data quality benefits of frozen cells versus cells in continual culture. Additional benefits of using frozen cells include significant savings in consumables, growth media and FTE resources.
Comparisons to similar experiments carried out previously on the previous generation of FlexStation readers, where the cells were washed manually, suggests that the use of the AquaMax 4000 Cell Washer can contribute to enhancements in assay quality.
Furthermore, we have shown simple assay optimization on the FlexStation 3 reader and the improvements in data fidelity facilitated with a “no wash” reagent, such as the FLIPR Calcium 5 Assay Kit.
References
- Zhang, J-H., Thomas, T.D.Y. and Oldenburg, K. R. (1999). A simple statistical parameter for use in evaluation and validation of high throughput screening assays. J. Biomol. Screen., 4, 67–73.
- Schucht, R., Lydford, S., Andzinski, L., Zauers, J., Cooper, J., Hauser, H., Wirth, D. and May, T. (2011). Rapid Establishment of G-ProteinCoupled Receptor–Expressing Cell Lines by Site-Specific Integration. J Biomol Screen., 16, 323-331.
Learn more about FlexStation 3 Multi-Mode Microplate Reader >>
简介
基于细胞的检测往往具有挑战性和耗费时 间。为了促进和简化这一复杂的过程,冷 冻细胞,可以在没有事先培养的情况下进 行检测,已经成为一种适合和经常使用的 替代细胞在持续生长的培养方式。冷冻细 胞使细胞培养与功能测试分离,有助于减 轻生物变异性,提高孔板与孔板之间的一 致性和数据保真度,增加测定时间的灵活 性,显著降低细胞培养成本。
FLIPR® Calcium 5 检 测 试 剂 盒 ( 图 1 ) 比其他“ 免洗 ”钙试剂表现出更好的性 能,并具有广泛的适用性,适用于各种生 物靶点的选择。消除通常的洗涤步骤具有 减少孔板处理和更快的检测通量的关键优 势。此外,在次最优分析条件下,使用均 相实验具有增强数据质量和降低孔间变异 性的潜力。
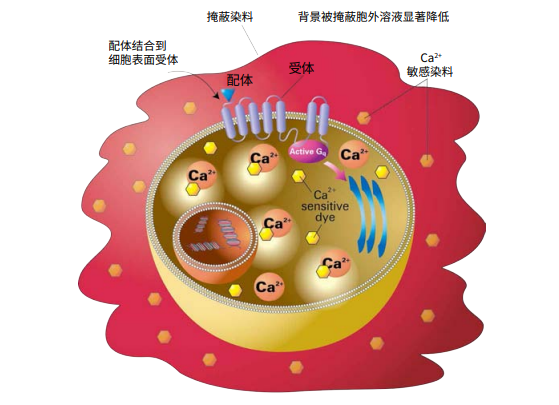
***图 1. FLIPR Calcium 检测原理。*FLIPR Calcium 检测试剂盒包括一种钙敏感染料,在培 养过程中被摄入细胞质中。试剂盒的掩蔽染料留在细胞外,阻挡背景荧光。配体与受体结 合后,钙被释放到细胞质中。染料与细胞内的钙结合,产生荧光。
FlexStation® 3 多功能微孔板读板机通过 直接将试剂从源孔板转移到读数孔板,为 基于分液器的系统提供了更多的灵活性, 从而减少了试剂和耗材的消耗。确定单个 试剂和浓度的能力可以在单个实验中探索 更多的检测条件,并使该系统成为激动剂 和拮抗剂研究的理想选择。
在本应用文献中,我们利用 FlexStation 3 读板机在具有代表性的 Gq-GPCR 检 测中 比较不同的 Ca2+ 指标 ( 包括单波长和双波 长 ),以突出使用均相的“ 免洗 ”钙试剂 的潜在优势。此外,我们还比较了连续培 养中的细胞和用冷冻试剂制备的细胞 ( 从 European Collection of Cell Cultures (ECACC) 中获得的“ 检测就绪 ”细胞 ) 之 间的检测性能和数据保真度。
材料和方法
- FlexStation 3 多功能微孔板读板机 (Molecular Devices)
- AquaMax® 4000 微孔板洗板机,安装有 96 孔洗头 (Molecular Devices
- ImageXpress® Micro 宽场高内涵筛选系 统 (Molecular Devices)
- FLIPR Calcium 5 Assay Explorer 试剂盒 (Molecular Devices, Cat. #R8185)
- Fluo-4 AM (Invitrogen, Cat. #F-14201)
- Fura-2 AM (Invitrogen, Cat. #F-1221)
- DAPI 核酸染料 (Invitrogen, Cat. #D-1306)
- 冷冻保存的表达人毒蕈碱 M3 受体的“ 检 测 就 绪 ”CHO 细 胞 (CHRM3, ECACC, Cat. #10031603)
- 水溶性丙磺舒 (Invitrogen, Cat. #P-36400)
- CHO 细 胞 生 长 培 养 基: 含 有 10% FBS 和 1% pen/strep 的 Hams F12: DMEM 培 养 基 (Invitrogen, Cat. #31331-093, 16140-071 and 15140-122)
- 含 有 钙 离 子 和 镁 离 子 以 及 20 mM HEPES 的 Hanks 平 衡 盐 溶 液 (HBSS) (Invitrogen, Cat. #14025-050 和 15630- 056)
- 细胞培养板 ( 黑壁、底透 96 孔 CellBIND 微孔板 , Corning, Cat. #3340)
- 乙酰胆碱,非选择性毒蕈碱受体激动剂 (ACh, Sigma, Cat. #A6500)
- 对 氟 六 氢 - 西 拉 - 二 芬 尼 多 盐 酸 盐 (p-Fluorohexahydro-sila-difenidol Hydrochloride), 毒 蕈 碱 受 体 拮 抗 剂 (p-F-HHSiD, Sigma, Cat. #H127)
- 甲醇 (Sigma, Cat. #179337)
方法
细胞处理和接种方法
- 连 续 培 养 的 表 达 毒 蕈 碱 M3 受 体 (CHRM3) 的 CHO 细 胞 在 200 µL 生 长 培 养 基中以 30,000 细 胞 / 孔 接 种,在实 验 台室温下维持 30 分钟,然后 37℃、95% 湿度和 5% CO2 下孵育过夜。
- “ 检 测 就 绪 ” 冻 存 的 CHRM3 细 胞 在 37 ℃ 水 浴 下 快 速 解 冻, 轻 轻 转 移 到 10 mL 温暖的生长培养基中并以 1000 rpm 离心 5 分钟。细胞重悬于生长培养基中并 以 50,000 细 胞 / 孔 接 种 于 200 µL 培 养 基中,孔板留在实验台室温下 30 分钟, 之 后 再 37 ℃、95% 湿 度 和 5% CO2 下 孵 育 18 小时。
- 冻存的 CHRM3 细胞在 37℃ 水浴下快 速解冻,轻轻转移到 10 mL 温暖的生长培 养基中并以 1000 rpm 离心 5 分钟。细胞 重悬于 10 mL 温暖的生长培养基中,然后 放回 CO2 孵箱中孵育 60 分钟。接着离心 后的细胞重悬于 FLIPR Calcium 5 检测试 剂中并以 75,000 细胞 / 孔接种在 100 µL 上样缓冲液 (loading buffer) 中。最后, 细 胞板 用 1000 rpm 离心 ( 没有停 转 ) 再 在 CO2 孵箱孵育 45 分钟。
FLIPR Calcium 5 检测试剂上样
染料上样缓冲液的制备是通过将一小管 染 料 的 完 全 溶 解,使 最 终 体 积 为 20 mL 的 Hanks 平 衡 盐 溶 液 (Hanks Balanced Salt Solution),用 20 mM HEPES、2.5 mM 丙 磺 舒 调节至 pH 7.4。用细 胞 制 备方法 (1) 和 (2) 制备的细胞板,从孵箱中取出, 移去生长培养基并加入 100 µL 染料上样 缓冲液到各个孔。染料上样板在 37℃、 5% CO2 下孵育 45 分钟并允许在检测前室 温下平衡 15 分钟。染料上样后不用洗涤 且每孔的初始检测体积为 100 µL。
Fluo-4 AM 和 Fura-2 AM 染料上样
根据上述方法 (2) 制备的细胞用 100 µL/ 孔 的 Fluo-4 AM 或 Fura-2 AM ( 2.5 µM 中 加入 2.5 mM 丙磺舒 ) 在 37℃ 下孵育 45 分钟,接着吸去生长培养基。然后在安装 有 96 孔 细 胞 洗 头 的 AquaMax 4000 微 孔 板 洗 板 机 上 用 加 有 2.5 mM 丙 磺 舒 的 HBSS 缓冲液洗涤细胞板。洗涤程序包括 了一系列程序化的吸液和分液步骤 ( 表 1 )。
表 1 CHRM3 细胞钙流检测中的 AquaMax 4000 微孔板洗板机参数。
在 ImageXpress Micro 系统上进行细胞数 量确认
为了染料对比测试来验证细胞数量和融 合度,用上述细胞方法 (2) 制备的培养板 用 DAPI 核 酸 染 料 染 色,在 ImageXpress Micro 宽场高内涵筛选系统上成像。简而 言之,制备不同密度的细胞并在 37℃、 95% 湿 度 和 5% CO2 下 孵 育 18 小 时。去 除 生长培 养基,代 之以 100 µL 每 孔的冰 冷甲醇。5 分钟后移去甲醇,加入 100 µL 每 孔 的 DAPI 溶 液 (300 nM), 孵 育 5 分 钟 后 用 HBSS 清 洗 三 次。 接 下 来 用 4X 物镜 对细胞单层成像以测量整孔面积, 用 MetaXpress® 软 件 的 Count Nuclei Application Module( 核计数应用模块 ) 得 出每孔总细胞数。
细胞优化实验
为比较三种不同的细胞处理方法,乙酰胆 碱 (ACh) 激 动 剂 响 应 曲 线 和 p-F-HHSiD 拮抗剂抑制曲线以定性和定量方式进行 比 较。在 染 料 孵 育 和 室 温平 衡后,在 室 温下进行钙动员检测。在 3X 终浓度下、 HBSS 缓冲液和 96 孔聚丙烯孔板中制备 乙酰胆碱 (ACh) 稀释系列 ( 检测浓度 0.03 nM–300 nM ),以 50 µL/ 孔 加 入 到 细 胞 板的各个孔中以刺激胞内 Ca2+ 的释放。
对于拮抗剂的研究,以 3X 浓度制备 p-FHHSiD 并离线加入 15 分钟后添加 50 µL 4X 浓度的 ACh (EC80)。
在化合物添加前、中、后检测荧光 90 秒。
钙指示剂对比实验
在 FlexStation 3 读板机上用‘Flex’读数 模 式 测 定钙 流。加入了 FLIPR Calcium 5 检 测试剂、Fluo-4 AM 或 Fura-2 AM 的细 胞,用整合了 8 通道移液器的 FlexStation 3 读 板 机 以 不 同 浓 度 ACh ( 20 pM 到 8 µM,5 倍稀释 ) 对细胞进行挑战。用优化 后的参数在化合物添加前、中、后测定荧 光 90 秒 ( 表 2 )。
表 2 使用 FlexStation 3 读板机在 CHRM3 细胞中进行钙染料对比的 SoftMax Pro 软件 优化设置。
对于拮抗剂的研究,p-F-HHSiD 手工添加 到合适的孔中并允许平衡 15 分钟再将孔 板 放 入 FlexStation 3 中。仪 器 中 的 机 载 移液系统用于 50 µL/ 孔的 Ach 分液 ( EC80 浓度 ),与此同时实时监测荧光的变化。
数据分析
以峰 值 荧 光强 度 (FLIPR Calcium 5 检 测 试剂或 Fluo-4 AM) 或 Fura-2 AM 的最 大 340/380 nm 比值作为测定的响应。为了 让 对比简单,数 据在基线 上归 一 化 为 % 响应,表示为 mean ± s.e.m,n ≥ 4。
每组的浓度 - 效应曲线都拟合成四参数方 程:
这里 a、b、EC50 和 n 分别是上渐近线、 下渐近线、定位 (EC50/IC50) 和斜率参数。 所有的常规曲线拟合均由 SoftMax Pro 6 软件计算得到。
Z′ 因子使用以下方程计算:
这里 σc+ 表 示阳性对照的标准 差,σc表 示阴性对照的标准差。| µc+ – µc- | 表示阳 性对照信号平均值与阴性对照信号平均值 之差的绝对值。Z′ 因子 >0.5 说明在阴性 对照和阳性对照之间有一个很大的分离 带,因此,是一个可靠的实验。
结果
细胞优化实验
在所有三种细胞制备方法下,负载 FLIPR Calcium 5 检 测 试 剂 盒 的 CHRM3 细 胞 2 显 示出强 大的荧 光 增加,以响 应 ACh 的 应用 ( 图 2 )。
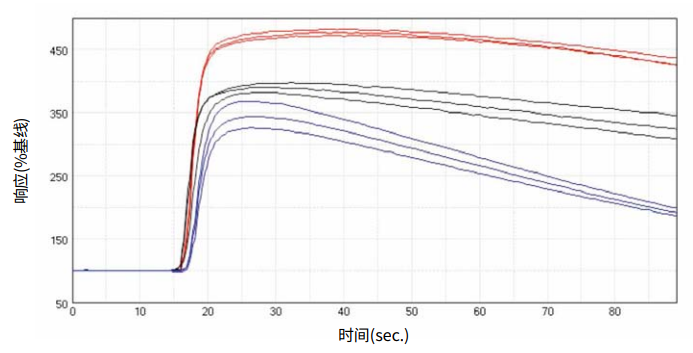
***图 2 动 力 学 追 踪。*加 入 了 FLIPR Calcium 5 试 剂 并 以 ACh (300 nM) 处 理 细 胞, 由 SoftMax Pro 6 导出的具有代表性的动力学追踪,在 FlexStation 3 读板机上。所展示的细 胞处理条件为 (•) 连续培养的细胞,(•) 冷冻细胞解冻后使用 18 小时或 (•) 来自冷冻细胞。 曲线图显示了 y 轴为超过基线的 % 响应对 x 轴为时间秒。
计 算 出 的 ACh 的 EC50 值 在 彼 此 0.5 log 单 位 内 ( 表 3 ),然 而,当 直 接 从 冷冻 细 胞 中 使 用 细 胞 时,EC50 值 有显著 的 (P < 0.05) 右旋偏移 ( 图 3 )。同样,三种细胞 制备方法对 p-F-HHSiD 的 IC50 估值也相 似。连续培养和冷冻细胞使用 18 小时的 Z′ 估值大于直接使用冷冻细胞获得的 Z′ 估值。
EC
50
/IC
50
EC
50
/IC
50
EC
50
/IC
50
1.9 x 10
-9
M
2.5 x 10
-9
M
6.3 x 10
-9
M
p
-F-HHSiD
3.6 x 10
-8
M
3.7 x 10
-8
M
4.9 x 10
-9
M
表 3 三种不同细胞处理条件下 FLIPR Calcium 5 检测试剂盒负载 CHRM3 细胞的比较结 果。*
* 注意 , 使用 EC80 响应计算激动剂数据的 Z′估计值。通过计算高于基线的峰值响应,得到超过基线的 % 响应 (% R/B) 参数,基线设置为 100% 响应。
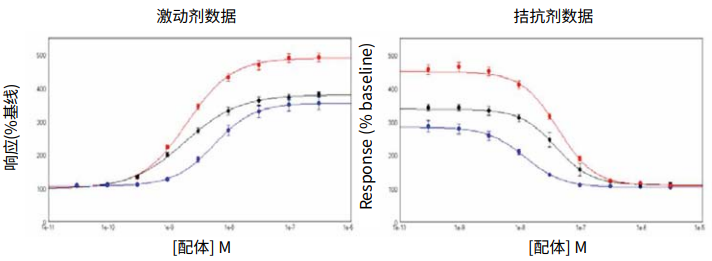
***图 3 激活 / 抑制曲线。*CHRM3 细胞加入 FLIPR Calcium 5 检测试剂用 ACh ± p-F-HHSiD 处理的激活 / 抑制曲线。测试的细胞处理条件为 (•) 连续培养的细胞,(•) 冷冻细胞解冻后 使用 18 小时或 (•) 来自冷冻细胞。
根据 EC50 的估值、更 大的信号幅度和这 些初步研究的 Z′ 值的提高、更容易的细 胞制备和更低的消耗成本,随后的所有实 验都是在接种后 18 小时使用的冷冻细胞 中进行的 ( 方法 2 )。
ImageXpress Micro 系统上的细胞数确认
为了经验性地验证细胞数和融合度,根据 细胞制备方法 (2) 制备了两种具有代表性 的细胞板。第二天,用 DAPI 核酸染料染 色。孔 板 放 置 于 ImageXpress Micro 宽 场高内涵筛选系统上进行成像 ( 图 4 )。
***图 4 细胞密度。*通过在 ImageXpress Micro 宽场高内涵筛选系统获得的代表性细胞密度 图像。在每个有代表性的孔上以数字表示最初细胞接种密度。
在 这一系列 实 验 中,给出 一 致单 层 的 最 佳细胞密度被确定为 50,000 个细胞 / 孔 ( 表 4 )。然后,这种细胞密度被用于所有 随后的实验。
***表 4 CHRM3 细胞通过 DAPI 染色获得的细胞密度结果。*使用 MetaXpress 软件的核计数 应用模块 (Count Nuclei Application Module) 分析数据。
钙指示剂比较实验
用 FLIPR Calcium 5 检测试剂盒、Fura-2 AM 和 Fluo-4 AM 分别负载的细胞,ACh 在 CHRM3 细胞中产生细胞内 Ca 2+ 的 浓 度依赖性增加 ( 图 5 )。
单向方差分析 (ANOVA) 表明,Fluo-4 AM 和 Fura-2 AM 数 据 集的 EC50 估值没有显 著差异 (P value=0.92)。
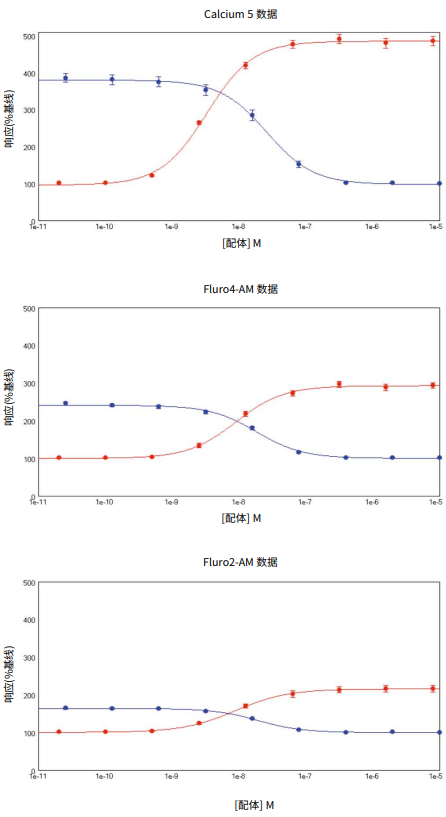
***图 5 Calcium 5 检测试剂盒数据。*SoftMax 6 Pro 软件曲线图展示 ACh (•) 或 p-F-HHSiD (•) 浓度 ( x 轴 ) 对应信号的 % 变化 ( y 轴 ) 为负载了 FLIPR Calcium 5 检测试剂、Fluo4 AM 和 Fura-2 AM 的细胞。数据为 mean ± s.e.m。
然而,FLIPR Calcium 5 检测试剂盒有一 个显著的 (P < 0.05) 的 EC50 值的左移,更 高的 Z′ 值和更大的响应 / 基线值 ( 表 5 ), 表明这种“ 免洗 ”方法是更理想的。
相比之下,p-F-HHSiD 数据表明,计算出 的 pIC50 值之间的差异可以忽略不计,表 明拮抗剂结合不受不同测定制备方法的显 著影响 ( 表 5 )。
筛选系数窗口 ( Z′ 因子 ) 反映了信号的动 态范围和测定的数据变化,采用缓冲液加 入 ( 阴性对照 ) 和 ACh ( 激动剂阳性对照 ) 的 EC80 浓 度 计 算。筛 选 系 数 窗 口 ( Z ′ 因 子 ),它反映了信号的动态范围和测定的 数据变化,使用缓冲液添加 ( 阴性对照 ) 和 ACh ( 激动剂阳性对照 ) 的 EC80 浓度计 算。三 种 染 料 的 Z ′ 因 子 均 >0.5 ( 表 5 )。 这表明阴性对照和阳性对照之间有一个很 大的分离带,并且是重复性和高质量的实 验方法。然而,FLIPR Calcium 5 检测试剂 盒的数据始终比其他 2 个钙指示剂产生更 高的 Z′ 值,并且明显有更高的响应 (% R/ B)。
EC
50
/IC
50
EC
50
/IC
50
EC
50
/IC
50
3.1 x 10
-9
M
7.9 x 10
-9
M
3.7 x 10
-9
M
p
-F-HHSiD
2.3 x 10
-8
M
2.0 x 10
-8
M
2.1 x 10
-9
M
Table 5. FlexStation 3 reader results for CHRM3 cells loaded with the three different calcium indicators (n ≥ 6).
总结
FlexStation 3 读 板 机 与 FLIPR Calcium 5 检测试剂盒已被证明能最佳地测定表 达毒蕈碱 M3 受 体 的“ 检 测 就 绪 ”冷冻 CHO 细胞中细胞内 Ca2+ 的变化。双单色 器有助于最佳激发和发射波长的选择, 并允许同时使用单波长和双波长比例指示 剂。
最近出现的冷冻细胞作为可行的分析试 剂,进 一 步简 化了分析 的 发 展 和 筛 选 过 程,我们成功地证明了冷冻细胞与细胞在 持续培养中的数据质量优势。使用冷冻细 胞的额外好处包括大幅节省消耗品、生长 培养基和 FTE 资源。
与以 前 在 前 一 代 FlexStation 读 板 机 上 进 行 的 类 似 实 验 进 行 的 比 较 表 明, 在 FlexStation 读板机上,细胞是手动清洗 的, 这 表 明 使 用 Aquamax4000 细 胞 洗 板机可以有助于提高检测质量。
此 外,我们还 展示了对 FlexStation 3 读 板机的简单检 测优化,以 及 用“ 免洗 ” 试剂,如 FLIPR Calcium 5 检测试剂盒促 进数据保真度的提高。
参考文献
- Zhang, J-H., Thomas, T.D.Y. and Oldenburg, K. R. (1999). A simple s t at i s t i c al p a r a m e te r f o r u s e in evaluation and validation of high throughput s cre ening as s ays . J. Biomol. Screen., 4, 67–73.
- Schucht, R., Lydford, S., Andzinski, L., Zauers, J., Cooper, J., Hauser, H., Wir th, D. and May, T. (2011). Rapid Establishment of G-Protein-Coupled Receptor–Expressing Cell Lines by Site-Specific Integration. J Biomol Screen., 16, 323-331.
Learn more about FlexStation 3 Multi-Mode Microplate Reader >>