
Application Note
Optimized Wavelength Scanning of Fluorescent Proteins with the SpectraMax Paradigm Platform and TUNE Technology
- Excellent sensitivity over a complete range of fluorescent labels
- Flexible wavelength scanning options
- More efficient assay optimization with patented Spectral Optimization Wizard
Introduction
The SpectraMax® Paradigm Multi- Mode Microplate Reader with Tunable Wavelength (TUNE) Detection Cartridge from Molecular Devices combines the flexibility of wavelength scanning with the high sensitivity of filters. The TUNE detection cartridge uses a breakthrough monochromator design that enables researchers to easily optimize their assays over a wide range of wavelengths. Excitation can be set from 360 nm to 790 nm, and emission can be set from 400 to 850 nm, in increments of 1 nm. TUNE offers the additional functionality of time-resolved fluorescence and luminescence detection for an expanded range of assays.
A patent-pending Spectral Optimization Wizard simplifies the workflow by automatically calculating signal to background and determining the optimal excitation and emission wavelengths for any scanned fluorophores. A heat map graphically displays calculated signal to background results for scanned wavelength pairs and allows users to read their assay using automatically optimized wavelengths, providing an 80-fold increase in sensitivity for EGFP detection compared to simply using excitation and emission peak wavelengths.
Excitation and emission spectral scanning
Individual excitation and emission spectral scans were performed on two green fluorescent protein variants. Recombinant wild-type GFP (Clontech) and enhanced GFP (EGFP, BioVision) were both diluted to 10 mg/mL in TE buffer, pH 8. GFP samples (50 mL) were pipetted into a black 384-well microplate for measurement of spectral properties. Blank wells containing buffer only were included for reference.
For individual excitation and emission spectral scans, integration time was set to 140 ms. For excitation scans, the emission wavelength was set to 530 nm while scanning the excitation spectra at 2-nm increments from 360 to 500 nm. For emission scans, the excitation wavelength was set to 440 nm while scanning the emission spectra at 2-nm increments from 470 to 600 nm. The excitation peak of EGFP was shown to be red-shifted from 394 nm to 482 nm, while the emission peaks remain similar at 506 nm (GFP) and 512 nm (EGFP; Figure 1).
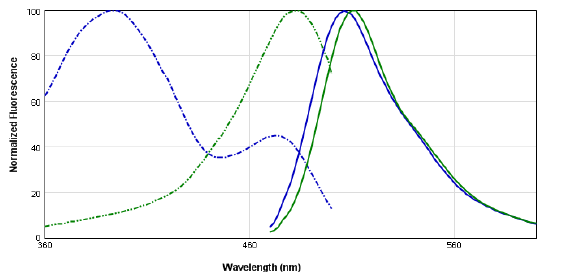
Figure 1. GFP and EGFP spectra, obtained using TUNE and spectrum setting in SoftMax® Pro 6 Software. Two Aequorea victoria GFP variants were examined for a shift in their excitation maxima. Dashed lines represent excitation spectra; solid lines represent emission spectra.
Spectral Optimization Wizard
The Spectral Optimization Wizard in SoftMax® Pro 6 Software was used to determine optimal wavelengths for detecting GFP and EGFP. Selection of the Spectral Optimization Wizard is shown in Figure 2. An example of settings and wavelength ranges for performing the optimization is shown in Figure 3.
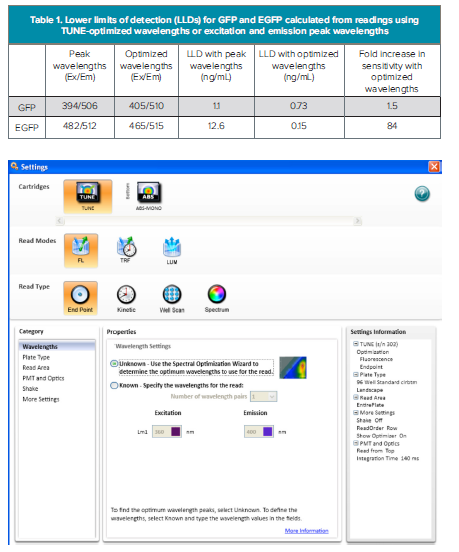
Figure 2. Spectral Optimization Wizard. Selecting the Spectral Optimization Wizard for the TUNE cartridge in SoftMax Pro 6 Software. Endpoint read type mutst be selected in order to use the Spectral Optimization Wizard.
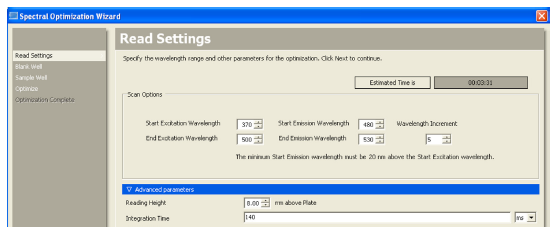
Figure 3. Wavelength ranges. Selecting the wavelength ranges and increment in the Spectral Optimization Wizard.
The Spectral Optimization Wizard scans excitation and emission simultaneously and calculates signal to background for each excitation/emission wavelength pair using the following formula: (Signal – Background)/Background. Results are displayed in a heat map, and the excitation/emission wavelength pair giving the highest signal to background value is highlighted with a crosshair icon. Results for GFP and EGFP are shown in Figure 4.
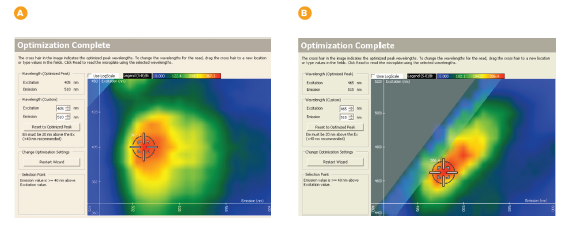
Figure 4. Optimized excitation and emission results for spectral optimization wizard showing heat map and optimized excitation and emission wavelengths for GFP (A) and EGFP (B). The optimized wavelengths determined by the Wizard were 405 nm excitation and 510 nm emission for GFP, and 465 nm excitation and 515 nm emission for EGFP.
Sensitivity in detecting the GFP variants is improved when using Wizard-optimized wavelengths, as shown in Table 1. For GFP, whose excitation and emission peak wavelengths are separated by 112 nm, the increase in sensitivity afforded by using the Wizard-optimized wavelengths instead of excitation and emission peak wavelengths is modest. However, for EGFP, whose peak excitation and emission wavelengths are separated by only 30 nm, a greater than 80-fold increase in sensitivity is provided by using the optimal wavelengths calculated by the Spectral Optimization Wizard. The optimal excitation and emission wavelengths are set at 50 nm apart, so interference by scattered excitation light is reduced.
Conclusion
The TUNE Spectral Optimization Wizard reduces the time required for users to optimize wavelengths for new fluorophores by at least 50% by automatically identifying an optimal wavelength pair for any given fluorophore. Spanning a range of 360-790 nm for excitation and 400-850 nm for emission, TUNE can detect all of the most commonly used fluorophores. TUNE-optimized wavelengths offer the greatest benefit for assays that use fluorophores with a narrow Stokes’ shift and, as demonstrated above, can result in an 80-fold increase in sensitivity for EGFP detection. In addition to fluorescence intensity, TUNE offers time-resolved fluorescence and luminescence detection modes for expanded assay versatility.