
Application Note
Multi-parametric assessment of compound-induced pro-arrhythmic effects in human iPSC-derived cardiomyocytes
- Characterize CiPA cardiotoxic compounds using iPSC cardiomyocyte phenotypic assays
- Improve calcium peak resolution with HS EMCCD camera recording up to 100 images per second.
- Enhanced peak characterization with new ScreenWorks Peak Pro 2 software
Oksana Sirenko | Senior Research Scientist | Molecular Devices
Krithika Sridhar | Manager, Software Engineering | Molecular Devices
Carole Crittenden | Applications Scientist | Molecular Devices
Introduction
Development of biologically relevant, predictive cell-based assays for compound screening and toxicity assessment is a major challenge in drug discovery. The focus of this study was to establish cardiotoxicity assays compatible with high-throughput screening using human induced pluripotent stem cell (iPSC)-derived cardiomyocytes. In order to assess the utility of human iPSC-derived cardiomyocytes as an in vitro pro-arrhythmia model, we evaluated the concentration dependence and responses to 28 drugs linked to low, intermediate, and high torsades de pointes (TdP) risk categories from a list of compounds suggested by the CiPA initiative1.
The impact of various compounds on the contraction rates and patterns of spontaneous cardiomyocyte activity was monitored by changes in intracellular Ca2+ oscillations measured by fast kinetic fluorescence with a calcium-sensitive dye. Advanced image analysis methods were implemented to provide multi-parametric characterization of the Ca2+ oscillation patterns. In addition, we used high-content imaging methods to characterize compound effects on viability, cytoskeletal re-arrangements, and mitochondria potential of cardiac cells.2 This phenotypic assay allows for the characterization of parameters such as beating frequency, amplitude, peak width, rise and decay times, as well as cell viability and morphological characteristics. The results demonstrate the utility of iPSC cardiomyocytes to detect drug-induced proarrhythmic effects in vitro.
Calcium Oscillations Evaluated by FLIPR Penta System
iPSC-derived cardiomyocytes generate spontaneous, synchronized calcium oscillations. We used high speed fluorescence imaging on the FLIPR® Penta High-Throughput Cellular Screening System to measure the patterns and frequencies of the Ca2+ oscillations in cardiomyocytes as monitored by changes in intracellular Ca2+ levels with the Molecular Devices EarlyTox™ Cardiotoxicity Kit. A set of 28 known cardiotoxic compounds, plus several benchmark compounds and negative controls were tested in the assay.
Instrument
The FLIPR Penta system is powered by a new high-speed camera and the new ScreenWorks® Peak Pro 2 software module.
The instrument is equipped with a ScreenWorks Peak Pro 2 peak analysis software module that allows analysis and characterization of the primary and secondary peaks and complex oscillation patterns associated with iPSC-derived cardiomyocytes and neurons. Some of the parameters available in ScreenWorks software are shown in Figure 2.
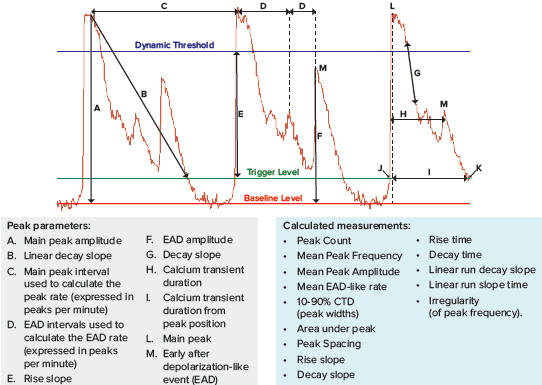
Figure 2. New ScreenWorks Peak Pro 2 software equipped with additional tools for peak analysis using >20 descriptors for observed phenotypic changes. The intracellular Ca2+ oscillations were assessed using the EarlyTox Cardiotoxicity Kit.
Methods
iPSC-derived cardiomyocytes
Cryopreserved human iPSC-derived cells from Cellular Dynamics International (CDI) iCell® Cardiomyocytes2 were used for experiments. Cells were thawed and plated at 20,000/well (96-well format) or 10,000/well into 384-well format plates (Corning) and incubated for seven days in maintenance media. The presence of strong synchronous contractions in the cultures was confirmed visually prior to running experiments. An example of changes in fluorescence with calcium flux in iPSC cardiomyocytes on the ImageXpress® Micro Confocal High-Content Imaging System is shown in Figure 1.

Figure 1. Calcium oscillation measured using the ImageXpress® Micro Confocal system. 0.2 second time lapse images of iPSC cardiomyocytes loaded with a calcium dye.
Cardiomyocytes were exposed to compounds for 15, 30, 60, 90 min or 24 hours, or as indicated in the figures.
Calcium oscillation assay
The intracellular Ca2+ oscillations were assessed using the EarlyTox Calcium dye (Catalog #R8210, Molecular Devices). According to regular protocol, cells were loaded with dye for two hours before measurements. Cells were exposed to compound for various lengths of time. Images were taken every .03 seconds for 1–2 minutes. ScreenWorks Peak Pro 2 software was used to characterize peaks. Examples of parameters are shown in Figure 2.
Cell staining
To assess phenotypic changes, cells were stained live using a mixture of three dyes: the viability dye, Calcein AM (1 μM), the mitochondria potential dye, MitoTracker Orange (0.2 μM), and the Hoechst nuclear dye (2 μM) (all from Life Technologies).2
Results
Recording and analysis of kinetic patterns
iCell cardiomyocytes2 from Cellular Dynamics Int. Fujifilm Co. were loaded with EarlyTox Cardiotoxicity Kit and treated with compounds as described above. Cell viability was assessed at the 24 hour endpoint. Spontaneous calcium oscillations were recorded using 30-50 frames per second to allow optimal resolution of the complex oscillation patterns. Advanced analysis methods in ScreenWorks Peak Pro 2 software were utilized to provide multi-parametric characterization of the Ca2+ flux oscillation patterns. This phenotypic assay allows for the characterization of readouts such as oscillation frequency, amplitude, peak width, peak and decay times, and irregularity. In addition, the appearance of EAD-like (early-after depolarization like event) patterns, peak prolongation, and peak irregularity were evaluated.
Phenotypic effects of compounds
Measurement of calcium oscillation in iPSC-derived cardiomyocytes is a promising method for toxicity assessment. In the present work we have focused on evaluation of a set of 28 CiPA compounds categorized as High, Medium, or Low risk for Torsades de Points according to clinical data. Torsades de Points is a heart beat irregularity condition that can be caused by these drugs in susceptible patients that often increasing risk of fatality. Examples of representative calcium oscillation patterns caused by some of the drugs tested are shown in Figure 3. Concentration response curves and EC50 values for peak count, amplitude, peak width increase at 90% peak height (CTD90), and decay time from peak height 20% to 80% are shown in Figure 4.
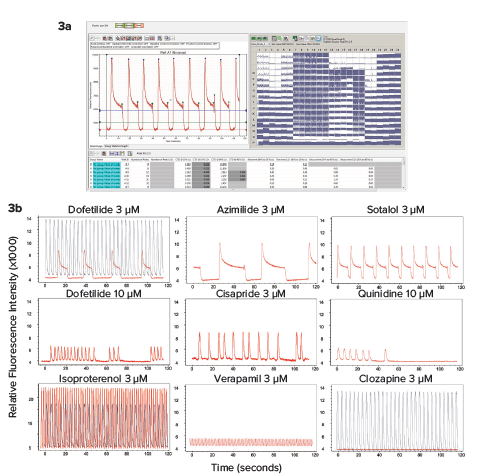
Figure 3. Using the new high speed EMCCD camera (FLIPR Penta system), we have tested the impact of various compounds on the rates and patterns of intracellular Ca2+ oscillations using a calcium-sensitive dye. 3a) High-throughput recording and analysis of the entire 384-well plate was done simultaneously using the FLIPR Penta system. 3b) Representative traces of calcium oscillations are shown for control and compound treated samples. Cells were loaded with dye for two hours and then treated with compounds for 30 min. Concentration-dependent changes in the patterns were observed. Oscillation traces were recorded by the FLIPR Penta system for two minutes. Patterns were characterized by ScreenWorks Peak Pro 2 software. Traces for compounds are shown in red, controls are shown in black.
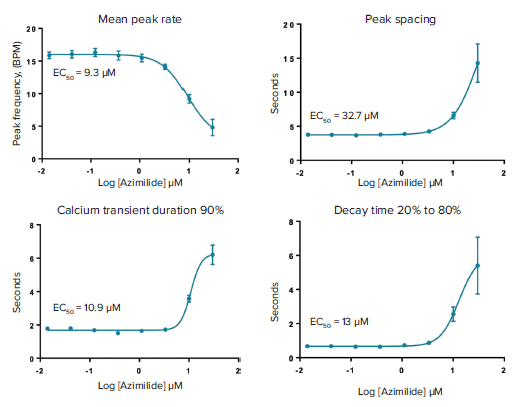
Figure 4. Concentration dependencies and calculated EC50 values for changes of mean peak rate, peak spacing, and peak prolongation.
Multi-parametric evaluation of cardiotoxicity effects
The assay shows promise for high-thoughput assessment of cardiotoxicity effects of compounds in vitro, which would help to evaluate and prioritize different drugs and new compounds for further testing. ScreenWorks Peak Pro 2 software allows more than 20 descriptors of waveforms. We have evaluated a multi-parametric approach for description of changes in oscillations. Table 1 illustrates several parametric measurements for drugs associated with risk of Torsades de points (TdP) syndrome in the heart, which can cause it to stop beating upon administration to a susceptible patient.
TdP risk
1
Cmax (μM)
1
Peak count EC
50
(μM)
2
Amplitude EC
50
(μM)
2
1 TdP Risk and Cmax1\ 2 EC50 values from ScreenWorks Peak Pro 2 software
* The lowest concentration (μM) that caused specific changes for different read outs from ScreenWorks Peak Pro 2 software
If there were no changes observed, this was indicated by a "–" Table 1. Phenotypic assay results. Three risk levels of cardiac drugs are characterized by multiple parameters including peak characteristics and cytotoxicity.
Assessment of cell morphology and viability by high content imaging
Confocal imaging and image analysis methods were used to characterize compound effects on the morphology and viability of iPSC derived cardiomyocytes. To evaluate cytotoxicity effects, cells were imaged with the ImageXpress Micro Confocal system after treatment with compounds for 24h. Images were analyzed using a Cell Scoring algorithm for detection of cell numbers for all cells, live cells (Calcein AM positive cells), and cells with intact mitochondria (MitoTracker positive cells). Results are shown in Figure 5.
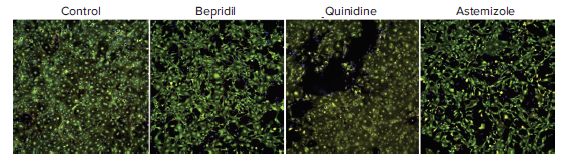
Figure 5. Composite images of cardiomyocytes treated with 10 μM of indicated compounds for 24h, then stained with a nuclear stain (Hoechst 33342, blue), viability stain (Calcein AM, green), and mitochondria membrane potential dye MitoTracker Orange CMTMRos (red) for 2 hours (2 μM, 1 μM, and 0.5 μM respectively). Cells were imaged with the DAPI, FITC, and TRITC, filter cubes and the 10X Plan Fluor objective. Cytotoxicity was observed after 24h for the following compounds at concentrations 10 μM or greater: azimilide, bepridil, quinidine, astemizole. Similar data for clarithromycin, terfenidine, tamoxifen and vandetenib is not shown.
Summary
- The FLIPR Penta system equipped with a high speed camera allows better resolution of calcium oscillation patterns in cardiomyocytes.
- The new ScreenWorks Peak Pro 2 software allows complex event analysis and detailed characterization of the patterns using more than 20 available pattern descriptors.
- We developed the methods and demonstrated feasibility of using the iPSC-derived cardiomyocytes for evaluation of compound effects and potential cardiotoxicity.
- A variety of phenotypic responses were demonstrated using a set of 28 known inducers of cardiac arrhythmia (CiPA compounds). Representative data is shown.
- These assays can be used to test developing drugs and screen chemicals for potential cardiotoxic hazards.
References
- Blinova et al., 2018, Cell Reports 24, 3582–3592, 25 September, 2018
- Sirenko et al, Toxicol Appl Pharmacol. 2017
- Kopljar et al, Stem Cell Reports 2018