Application Note
3D Immune Cell Migration
- Create complex cell migration assays that are easily scalable and compatible for high-content imaging
- Perform quantitative assessment of immune cell dynamics, generating high-throughput readouts such as cell numbers and cell migration distance
Introduction
Angeline Lim, PhD | Applications Scientist | Molecular Devices
Oksana Sirenko, PhD | Sr. Applications Scientist | Molecular Devices
Thomas Olivier | Bioinformatics Engineer | MIMETAS
Johnny Suijker | Scientist | MIMETAS
Cell migration is an essential process for many biological phenomena such as early embryonic development and immune cell response. During inflammation, the recruitment of T cells through the vascular system towards the site of inflammation is a crucial component. These T cells are recruited by different factors such as pro-inflammatory cytokines (TNFα , IFN-γ) and chemokine gradients. After their recruitment and adhesion to the endothelium, T cells need to migrate to the inflamed tissue across the vascular wall through a process called transendothelial migration (TEM). This entails successful navigation through the complex 3D environment of living tissues and squeezing through dense structures by remodeling the extra cellular matrix (ECM) and/or by undergoing specific cellular adaptations.
In this study, we set out to develop an in vitro assay utilizing the MIMETAS’ OrganoPlate® 3-Lane 40 to study T cell dynamics in combination with a blood vessel structure under perfused conditions. Human primary T cells were apically added to the vessel lumen to study subsequent extravasation and migration into the adjacent ECM in the presence or absence of various factors. Highcontent imaging was used to observe the migration of cells at various time points. Here, we describe the imaging and analysis methods used to quantify the number of cells undergoing transendothelial migration in response to different concentrations of pro-inflammatory cytokines.
Materials
- OrganoPlate platform (MIMETAS)
- Endothelial cell source
- CD3+ T cells
- AIM V media (Invitrogen, 12055091))
- Collagen I 5 mg/mL (AMSbio Cultrex 3D collagen I rat tail, 5 mg/mL, #3447-020-01)
- 1M HEPES (Life Technologies 15630-122)
- 37g/L NaHCO3 (Sigma S5761-500G)
- PBS (Sigma)
- CellTracker Orange CMRA (Invitrogen, C34551)
- CD3/CD28 Human T-activators DynaBeads (Gibco, 11161D)
- TNFα (R&D systems, 210-TA-020)
- Chemokine trigger
- ImageXpress Micro Confocal High-Content Imaging System (Molecular Devices)
- MetaXpress High-Content Image Acquisition and Analysis Software, version 6.6 (Molecular Devices)
Methods
Model
To assess the T-cell dynamics in combination with a blood vessel structure under perfused conditions, an endothelial vessel was grown in the OrganoPlate 3-lane. Endothelial cells were seeded against a collagen I extracellular matrix (ECM) at a density of 10,000 cells/chip in the top perfusion channel. After attachment, the culture was maintained under perfusion conditions to generate 3D microvessels within the perfusion channel. The inflammatory status of the microvessel was mimicked by the addition of the pro-inflammatory cytokine TNFα in a dose-dependent manner inducing adhesive properties of the endothelium involved in the transendothelial migration. In this model, a chemokine gradient was obtained by adding the chemokine in the bottom channel of the OrganoPlate 3-lane. CD3+ T cells, either stimulated or unstimulated using CD3/CD28 human T-activator Dynabeads for 48 hours, were labelled with a cell tracker allowing to live track the extravasation of T-cells from the endothelial vessel into the adjacent extracellular matrix.

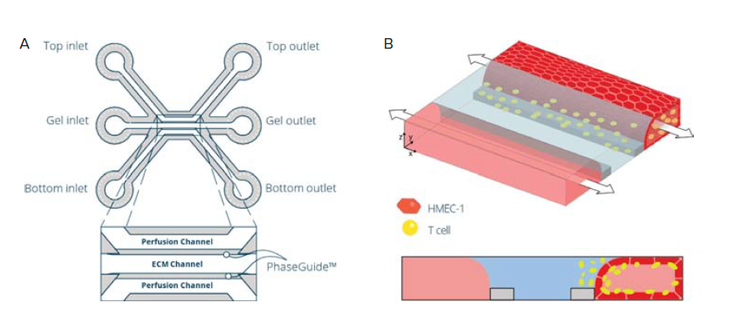
Figure 1. Establishment of a T cell perfused endothelium-on-a-chip model in the OrganoPlate. A) A schematic image showing one of the forty microfluidic chips of the OrganoPlate® 3-Lane 40 consisting of three channels: two medium perfusion channels and a gel channel in the middle separated by Phaseguides™. These channels join in the center of the chip, in the observation window (OW) well. B) Schematic representation of the seeding strategy for establishing an immune cell perfused endothelium-on-a-chip model.
Experimental set-up
CD3+ T cells were cultured and either stimulated or not using human T-activator Dynabeads for 48 hours.
Imaging and analysis
Images of T-cell extravasation and organization were captured at regular intervals using the ImageXpress® Micro Confocal System (Molecular Devices). A 10x air objective (0.45NA) and 60μm Nipkow spinning disk were used to capture Z-stacks of fluorescent images at a resolution of 0.69x0.69x3μm/pixel (XYZ). The stacks were then projected along the Z-axis to create maximum intensity projections (MIPs) of the data.
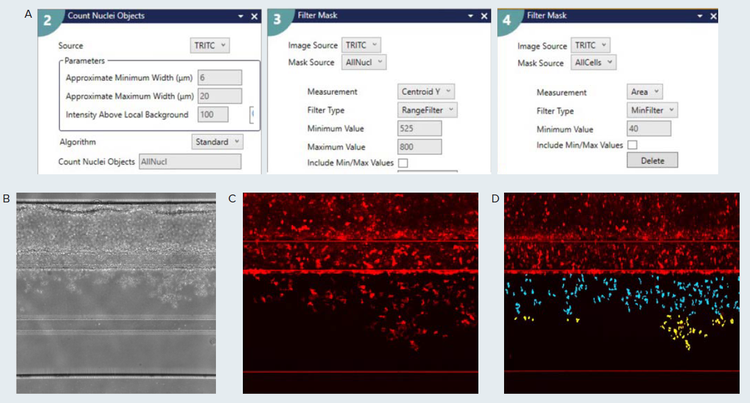
All images were then analyzed using a customized protocol built using the MetaXpress software (Version 6.6, Molecular Devices) custom module editor (CME) (Figure 3). Briefly, the CME includes the Count Nuclei application module in which the T cells were identified based on sizes and intensity above background levels. A series of filtering steps was used to identify the population that resides within the ECM channel (Figure 2). The precise location of the ECM channel was defined for every experiment to correct for plate-to-plate and plate-loading variations.

Figure 2. Image acquisition and analysis workflow. A) ImageXpress micro confocal high-content screening system (Molecular Devices). B) MetaXpress custom module editor graphical user interface. The image processing steps are defined in steps on the left, an image of the current step and a preview of the results in shown right and the full workflow is shown in thumbnails on the bottom.

Figure 3. Custom module editor set up for high throughput image analysis. A) The main steps used to identify the T-cell population is shown. The Count Nuclei application module was used to detect all cells in the image. The resulting image was filtered by position (Centroid Y) and area to more accurately identify the cells within the ECM channel. If required, additional filtering by position can be used classify the extent of migration towards the bottom channel. Specific measurements that include cell count, area, intensity, shape factor are available as well through the Measurement selection configuration tab. B) Phase-contrast image of Endothelial vessel and CD3+ T-cells. C) Cy5 fluorescent signal of previous sample, zoomed in. D) Results of the CME analysis showing segmentation overlay of ECM population of CD+ T-cells. The teal-colored cells are present in the upper half of the ECMchannel, and the yellow-colored cells are present in the bottom half of the ECM channel. The image is checked for imaging artifacts that could be falsely picked up by the segmentation routine.
Results
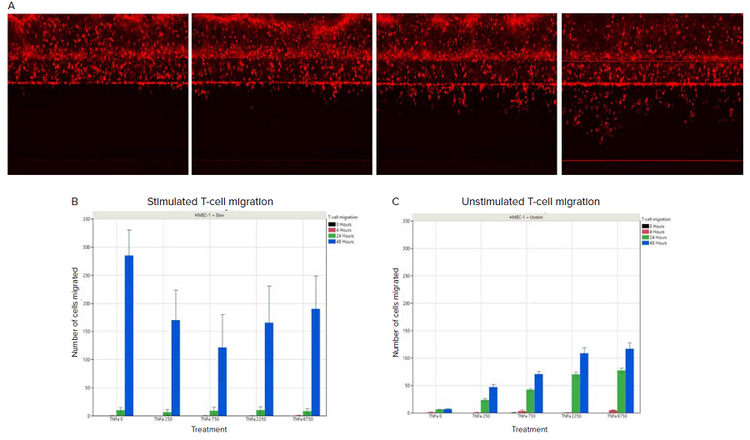
Transendothelial migration (TEM) was observed in both unstimulated and stimulated CD3+ T cells conditions. A time-dependent effect was observed in both the unstimulated and stimulated condition, although with a more nuanced trend in the unstimulated condition (Figures 4B and 4C). In the stimulated condition, almost no increase in TEM was observed for the 24h timepoint, whereas in the unstimulated condition a dose-dependent effect of TNFα treatment was observed for both the 24h and 48h timepoints. The overall amount of TEM at the 48h timepoint was significantly larger in the stimulated T-cell condition than the unstimulated conditions. The total TEM appears to be driven by a TNFα-mediated effect in the unstimulated condition and by the stimulation process for the stimulated T-cell condition.

Figure 4. T-cell migration with/without stimulation in response to TNFα treatment. A) Cell tracker labelled unstimulated T-cells at 0 hours, 4 hours, 24 hours, and 48 hours of TNFα treatment. An increase in the number of cells on the opposite side of the endothelial cell barrier was observed over time. B) Quantification of migrated stimulated T-cells in response to TNFα treatment. C) Quantification of migrated unstimulated T-cells in response to TNFα treatment. The amount of TNFα is indicated on the x-axis, in pg/ml.
Conclusion
In conclusion, we developed a novel 3D T-cell extravasation and migration assay using a high-throughput microfluidic platform. Using high-content microscopy, an accurate map of the migratory behavior of individual T cells can be extracted and assessed under different conditions. The migration assay captures the attachment of T cells to an endothelial vessel under flow and extravasation from this vessel wall into the underlying tissue. This assay is unimpeded by artificial membranes and allows the presence of a 3D ECM-like scaffold and multi-cellular co-culture which are crucial requirements for mimicking in vivo conditions. We believe the assay will improve current insights in T cell migratory behavior and can spur the development of novel therapies in the fields of immuno-oncology and auto-immunity.