
Application Note
Count cells with or without fluorescent labels using automated imaging
- Use fluorescently stained or unlabeled cells
- Count multiple cell types and sizes
- Identify pipetting artifacts or non-uniform cell growth prior to running assay
Introduction
Jayne Hesley | Imaging Applications Scientist | Molecular Devices
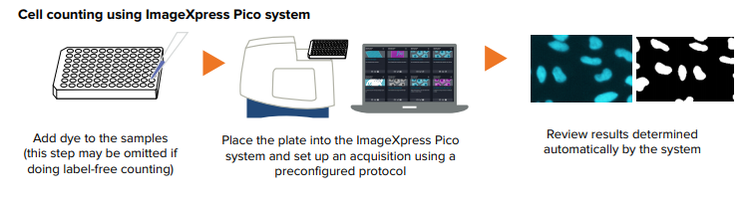
The ability to accurately quantitate cell number in multi-well microplates enables a multitude of biological applications that study cell health or proliferation. These applications may make use of endpoint assays for imaging fluorescently stained nuclei or may demand robust transmitted light imaging of unstained live or fixed cells. In both cases, the enumeration of the cells through software segmentation should be fast and reliable. The ImageXpress® Pico Automated Cell Imaging System with CellReporterXpress™ Image Acquisition and Analysis Software is ideal for quantitating cells whether label-free or fluorescently stained. In this application note, we demonstrate how the user’s choice of transmitted light segmentation (analysis) algorithms increase the accuracy of counting diverse cell types and compare the results to those found when using a nuclear stain.
Methods
In the following experiments, several cell types were plated into 96 well plates in 1:2 serial dilutions and grown overnight before being labeled with 5 µM Hoechst or DRAQ5 nuclear stain for 30-60 minutes inside an incubator at 37°C, 5% CO2 . Plates were read on the ImageXpress Pico system with a 4x or 10x Plan Fluor objective, one field of view/well. Fluorescent and transmitted light images were acquired consecutively (transmitted light first) and cells were counted using on-the-fly analysis. On-the-fly analysis allows for simultaneous analysis of an image during acquisition.
Select the best transmitted light module for your cells
Three modules are included in CellReporterXpress software for counting cells in transmitted light. “Transmitted Light Cell Count, General” works well for most monolayer cell culture (CHO, Hela, PC-12) that is neither too confluent nor too sparse. In the experiments reported in Figure 1, however, cells were plated into 96 well plates from fully confluent to only a few cells per well. The corresponding TL modules yielded cell counts that most closely agreed with the quantitation achieved using a nuclear stain over the widest range of cell densities. For cells like HepG2 which grow in clumps, accurate segmentation can be challenging at high densities, so it may be advisable to use the measurement “Area covered” instead of “Cell count” to get more accurate results.
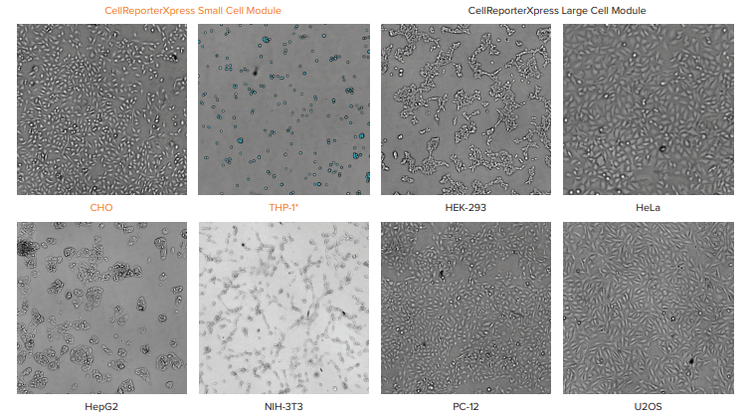
Figure 1 Figure 1. Comparison of different cell types from 156-20,000 cells/well shows CellReporterXpress software modules that segmented the transmitted light images most accurately. The transmitted light images were acquired at a z offset of -40 µm using a 10x objective. * THP-1 are suspension cells.
Count adherent or suspension cells
Adherent monolayers or suspended cells could be quantitated using one of the three transmitted light (TL) cell counting analyses protocols based on cell size or the Cell Count module for detecting fluorescently stained nuclei (Figures 2 and 3). A comparison of cells detected using stained nuclei vs. unlabeled cells was consistent across wells that were not overly-confluent (Figure 4).
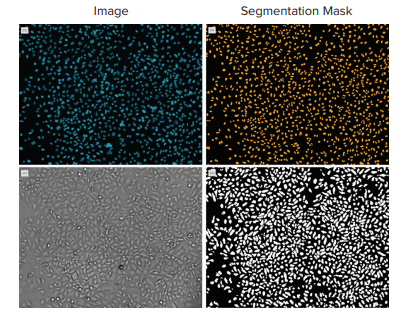
Figure 2. Comparison of cell count on HeLa cells using fluorescence and transmitted light. Top images show adherent HeLa cells acquired with a 10x objective on the left (blue nuclear stain) and the resulting analysis mask (orange) on the right. The lower panel shows the same region imaged with transmitted light (left) and the resulting analysis segmentation (white) on the right. Cell total was 1710 using nuclear count vs. 1790 using the transmitted light image.
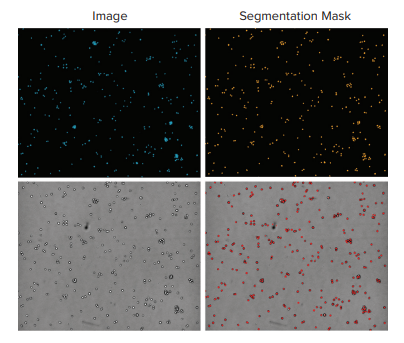
Figure 3. Comparison of suspension cells using fluorescence and transmitted light. Top images show THP-1 leukocytes acquired with a 10x objective on the left (blue nuclear stain) and the resulting analysis mask (orange) on the right. The lower panel shows the same region imaged with transmitted light (left) and the resulting analysis segmentation (red) on the right. Cell total was 325 using nuclear count vs. 320 using the TL image.
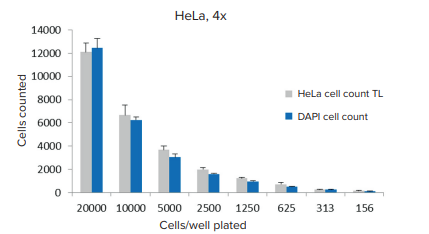
Figure 4. . A comparison of cell quantitation using transmitted light segmentation vs. Hoechst stained nuclei. A single image/well was acquired (n=6 wells) using a 4x objective and analysis was performed using CellReporterXpress software preconfigured modules.
Detect pipetting artifacts using whole plate thumbnail images
The entire plate can be scanned at low magnification in transmitted light (or fluorescence, if stained). Wells that demonstrate nonuniformity in the cell layer can be visually identified or detected on-the-fly using CellReporterXpress software (Figure 5).
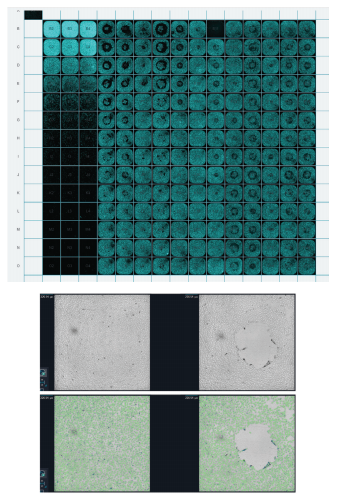
Figure 5. Identifying pipetting artifacts using low magnification scan of an entire plate. (Left) Plate montage view of Hoechst stained nuclei. Pipetting artifacts are readily apparent in the montage of this 384 well plate imaged at 4X. (Right) Transmitted light images (above) can be segmented and the analysis results (green mask overlay below) will highlight wells that do not contain a uniform number of cells.
Conclusion
The ImageXpress Pico system allows researchers to quantitate a wide variety of live or fixed cells in a logical workflow that supports on-the-fly analysis with the accompanying CellReporterXpress software. Using the low magnification scan method enables an instant quality check of plating uniformity. In addition, observing effects on cell density due to compound treatment or reagent addition add a higher level of validation to experimental results.
介绍
Jayne Hesley | Imaging Applications Scientist | Molecular Devices
在多孔微板中精确地定量细胞数量的能力 使得能够研究细胞的健康或增殖。这些应 用可以利用终点测定法来成像荧光染色的 细胞核,或者可以要求未染色的活细胞或 固定细胞的可靠透射光成像。在这两种情况 下,通过软件分割的细胞计数都应该是快速 和可靠的。ImageXpress® Pico 个人型高内 涵成像分析系统与 CellReporterXpress™ 图像采集和分析软件是理想的量化检测工 具,无论细胞是 label-free 或荧光染色。 在这个应用说明中,我们演示了用户选择 的透射光分割 ( 分析 ) 算法如何提高计数不 同细胞类型的准确性,并将结果与使用核 染色时发现的结果进行比较。
方法
在接下来的实验中,一些细胞类型被铺在 96 孔板中,按照 1:2 进行系列稀释并过夜 培养,然后 5μM Hoechst 或 DRAQ 5 核染 色在 37°C,5% 的二氧化碳孵育 30-60 分 钟。在 ImageXpress Pico 系统上用 4x 或 10x 物镜整板成像,每孔一个视野。荧光 和透射光的图像被连续地采集 ( 透射光优 先 ),并且使用即时分析 (on-the-fly) 计数 细胞。即时分析允许在获取过程中同时分 析图像。
为您的细胞选择更合适的透射光分析模块
CellReporterXpress 软件中包含三个模块, 用于计算透射光中的细胞数。“Transmitted Light Cell Count, General”适用于大多数 单层细胞培养 (CHO, Hela, PC-12),即不太 融合也不太稀疏。然而,在图 1 中所报告的 实验中,细胞被铺到 96 个孔里,从完全融 合到仅仅几个细胞。相应的TL模块产生的 细胞计数与核染色在最广泛的细胞密度范 围内实现的定量最接近。对于聚集生长的 HepG2 这样的细胞,在高密度的情况下, 精确的分割是有挑战性的,因此,为了获 得更准确的结果,最好使用测量“Area covered”而不是“Cell count”。
图 1. 通过对 156-20000 个细胞/孔不同细胞类型的比较,显示出 CellReporterXpress 软件模块对 透射光图像的分割最为准确。 透射光图像获得的 z 轴聚焦补偿值为 -40 μm,使用 10 倍的物镜。 * THP-1为悬浮细胞。
贴壁或悬浮细胞计数
根据细胞大小或细胞计数模块检测荧光染 色细胞核的三种透射光 (TL) 细胞计数分析 模块中的一种,可以定量贴壁单层细胞或 悬浮细胞 ( 图 2 和图 3 )。在未过度融合的 孔中,使用染色细胞核检测细胞与未标记 细胞的比较是一致的(图4)。
图 2. 利用荧光和透射光比较 HeLa 细胞的细胞计数。 最上面的图像显示,在左边有一个 10x 物镜 的贴壁 HeLa 细胞 ( 蓝色的核染色 ) 以及最终的分析 mask ( 橙色 ) 在右边。较低的面板显示了同一 区域与透射光成像 ( 左 ) 和结果分析分割 ( 白色 ) 在右边。使用核计数的细胞总数为 1710 个,而使 用透射光图像的细胞总数为 1790 个。
图 3. 荧光与透射光悬浮细胞的比较。 顶部图像显示用 10x 物镜获得的 THP-1 白细胞 ( 蓝核染色 )和 右侧得到的分析 mask ( 橙色 )。下面板显示的是用透射光成像的相同区域 ( 左侧 ),结果分析分割 ( 红色 ) 显示在右侧。使用核计数的细胞总数为 325 个,使用TL图像的细胞总数为 320 个。
图 4. 透射光分割细胞定量与 Hoechst 染色细胞核定量的比较。 使用4x物镜获取单个图像/孔 ( n=6 孔 ),使用 CellReporterXpress 软件预配置模块进行分析。
通过全板缩略图观察移液伪影
在透射光 ( 或荧光,如果染色 ) 下,可以低 放 大 倍 率 扫 描 整 个 平 板 。 可 以 使 用 CellReporterXpress 软件直观地识别或即 时 (on-the-fly) 检测细胞层中显示不均匀的 孔 ( 图 5 )。
图 5. 利用低放大率扫描整个板来识别移液伪影。( 顶部 ) Hoechst染色核的板块蒙太奇视图。在这 张 384 孔板 4 倍成像的蒙太奇图中,移液伪影非常明显。( 底部 ) 透射光图像 ( 上图 ) 可被进行分割 分析,分析结果 ( 绿色 mask 叠加于下图 ) 突出显示那些不含有均一细胞数量的孔。
结论
ImageXpress Pico 系统允许研究人员使用 配套的软件在支持即时分析 (on-the-fly) 的 逻辑工作流中定量各种活细胞或固定细 胞。采用低放大倍率扫描方法,可即时检 查铺板均匀性。此外,通过观察复合处理 或加入试剂对细胞密度的影响,可以对实 验结果进行更高程度的验证。