
Application Note
High-Content Screening of GPCR activation Using MetaXpress and AcuityXpress Software and the Transfluor Assay System
By Susan Catalano, Ph.D., Acumen Pharmaceuticals, Sylvia de Bruin, Joe Bosworth, Ph.D., Neal Gliksman, Ph.D., Kimberly Best, Ph.D. and Paula Rickert, Ph.D., Molecular Devices, 1311 Orleans Drive, Sunnyvale, CA 94089
Introduction
G-protein coupled receptors (GPCRs are the largest class of pharmaceutical targets and, as a result, assays for detecting GPCR receptor agonists and antagonists play a major role in screening operations. Recently Xsira Pharmaceuticals introduced the Transfluor® Assay, a novel high-content assay that monitors GPCR activation by measuring GPCR desensitization and recycling. The Transfluor Assay is now exclusively available from Molecular Devices.
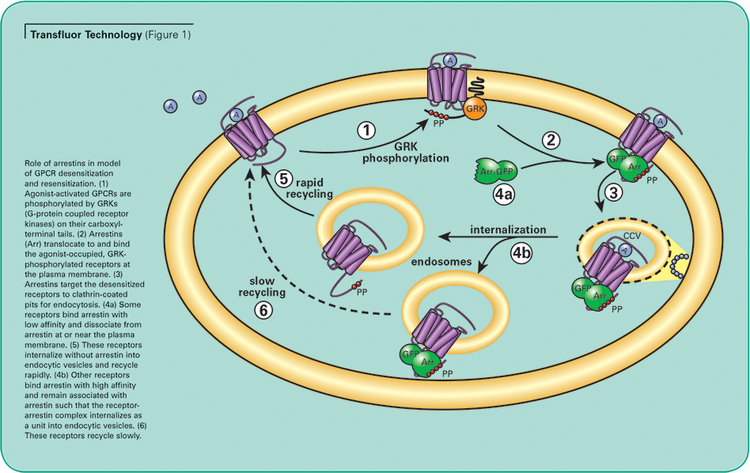
The Transfluor Assay, validated on over 90 different GPCRs, uses a common pathway independent of downstream G-protein signaling which is shared by virtually all GPCRs, representing all classes of GPCRs and G proteins. The assay uses image analysis to quantitate internalization of GFP-tagged beta-arrestin that associates with the receptor of interest following activation.1 (See Figure 1.)
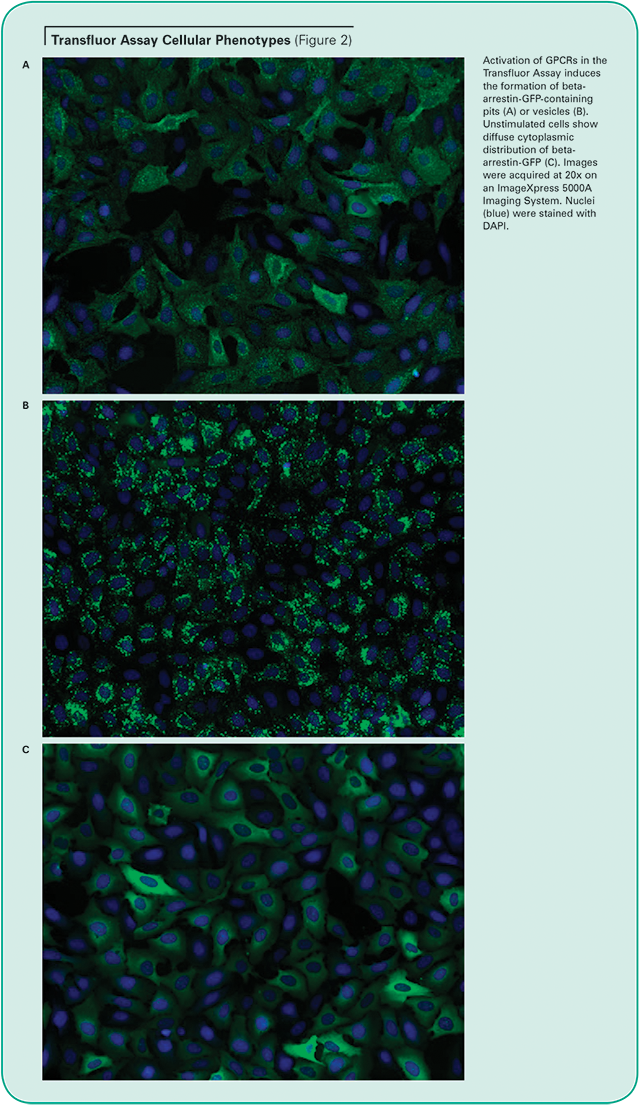
Unstimulated cells display diffuse cytoplasmic beta-arrestin-GFP fluorescence. When an overexpressed GPCR is activated, beta-arrestin targets the receptor for internalization, resulting in the appearance of small fluorescent clathrin-coated pits. If the receptor has a high affinity for betaarrestin, the cells subsequently form fluorescent endocytic vesicles, which are larger and brighter than pits. (See Figure 2.) The Transfluor Assay has been widely adopted as both a primary and secondary screen in many pharmaceutical drug discovery operations as a functional measurement of physiological events downstream of GPCR activation.
MetaXpress® Imaging Software fully automates image acquisition and analysis of the Transfluor Assay with all of Molecular Devices’ high-content screening systems, including the ImageXpress® 5000A and Discovery-1™ Instruments. Optional application modules provide assay-specific turnkey analysis of common high-content assays. The Transfluor module, described in this application note, was specifically designed and optimized for analyzing images from Transfluor Assays.
MetaXpress Software is integrated with the enterprise-level MDCStore™ Database for managing images, cell-by-cell segmentation results and annotations. The AcuityXpress Cellular Informatics Platform is also seamlessly integrated with the MDCStore database, providing powerful data visualization and statistical tools for curve fitting, evaluating assay quality, and identifying hits, false positives, outliers and trends. Used together, MetaXpress and AcuityXpress Software and the Transfluor Assay allow you to enhance your screening potential and rapidly discover GPCR modulators.
Practice of Transfluor Assays requires a license available only through Molecular Devices. Contact your local sales representative for details on licensing and available Transfluor Assay reagents.
Custom cell-by-cell analysis
MetaXpress Image Acquisition and Analysis Software optionally includes assay-specific application modules, designed for easy, interactive optimization of segmentation parameters. The simplified interface allows simple configuration and testing of analysis settings for your particular assay. (See Figure 3, Panel A.)
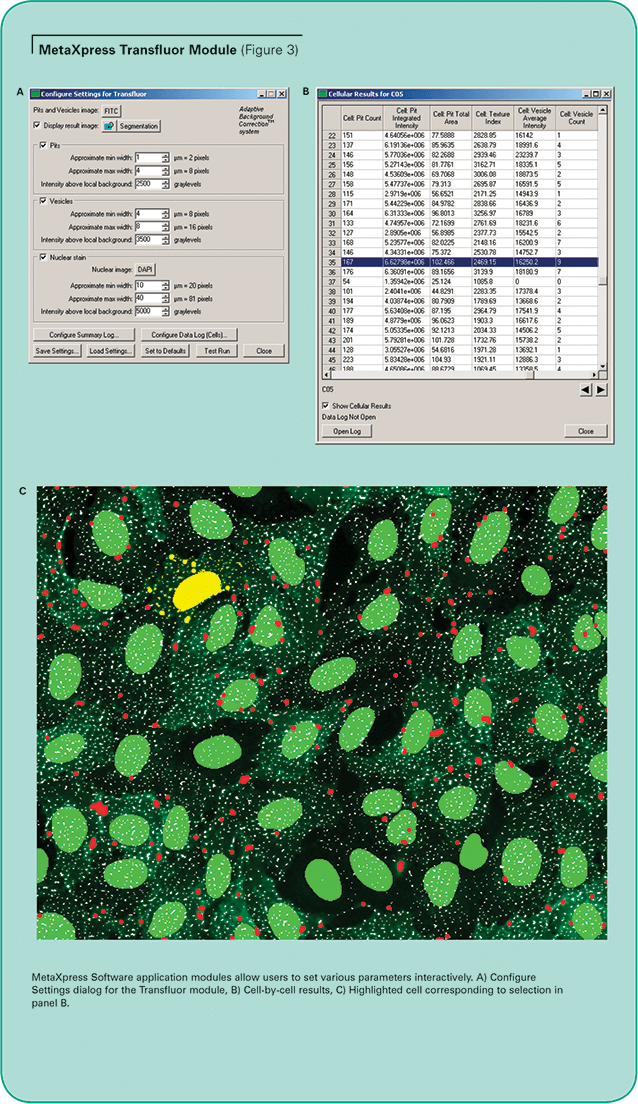
The MetaXpress Transfluor Module uses the proprietary Adaptive Background Correction system to distinguish pits, vesicles and nuclei from their local surroundings so they can be selectively measured and counted, even in the presence of uneven staining or protein expression levels. This can be difficult to do using ordinary thresholding methods because the intensity of the pits can be marginally above background, and the GFP-tagged beta-arrestin expression levels can vary from cell to cell.
With the Transfluor Module, designed for cell-bycell analysis of Transfluor data, pits and vesicles can be detected and distinguished simultaneously. The optional nuclear detection provides accurate counting of cells for data normalization. Three user-adjustable parameters are utilized for the image analysis. The “Approximate min width” and “Approximate max width” parameters are modified as needed for the expected size of the pits, vesicles or nuclei. The “Intensity above local background” parameter is adjusted for optimal discrimination of each pit or vesicle from the local background. This significantly improves the ability to identify and accurately quantitate actual pit and vesicle formation even if the intensity varies between cells in the image.
Multiple measurements can be logged to the database, including the number of pits or vesicles, total area covered by pits or vesicles, average and integrated intensity of the granules, and nuclear area and intensity. Results are provided on a cell-by-cell basis as well as summarized by image and site. Highlighting a row of the cellular results table immediately highlights the corresponding cell and overlay in the image. (See Figure 3, Panels B and C.)
Materials
Practice of Transfluor Assays requires a license from Molecular Devices. Transfluor Assay reagents are available to Transfluor licensees from Molecular Devices. Contact Molecular Devices for details.
Note: All solutions should be freshly prepared immediately before each experiment.
- Beta-arrestin-GFP and Beta-2-adrenergic receptor (β2AR)-expressing U2OS cells (Molecular Devices)
- Corning Costar 384-well microplates (Cat. #3712)
- U2OS media: MEM (Gibco Cat. #11095) with 10% heat-inactivated FCS (Gibco Cat. #10082), 10 µg/mL gentamicin (Gibco Cat. #15710), 10 mM HEPES (Gibco Cat. #11344), 0.4 mg/mL Zeocin (Gibco Cat. #R250) and 0.4 mg/mL G418 (Gibco Cat. #10131)
- Ascorbic acid media: 5.7 mM solution of ascorbic acid (sodium L-ascorbate, SIGMA Cat. #A7631) in serum- and antibiotic-free media (MEM with 10 mM HEPES)
- Isoproterenol stock solution: 175 µM stock solution of (-)-isoproterenol (+)-bitartrate salt (SIGMA Cat. #I2760) in ascorbic acid media
- Propranolol stock solution: 125 µM solution of (s)-(-)-propranolol hydrochloride (SIGMA Cat. #P8688) in serum- and antibiotic-free media (MEM with 10 mM HEPES)
- DPBS (SIGMA Cat. #D8537)
- 4% methanol-free formaldehyde: 16% methanol-free formaldehyde (Polysciences Cat. #18814) diluted 1:4 in DPBS
- DAPI, dilactate (Molecular Probes D-3571)
Methods
Agonist dose-response assay
Step 1. Plate cells at 4,500 cells/well in 25 µL of U2OS media. Incubate overnight at 37°C, 5% CO2.
Step 2. Perform 10 five-fold serial dilutions of the isoproterenol stock solution in the ascorbic acid media to form an 11-point series of 3.5X isoproterenol dose-response solutions. Use ascorbic acid media alone as a negative control. (See Table 1.)
Table 1. Concentrations of the Isoproterenol 3.5X Solutions Required for the Agonist Dose-Response Assay
Step 3. Add 10 µL of the appropriate 3.5X isoproterenol dose-response solution or negative control to each well.
Step 4. Incubate at 37°C, 5% CO2 for 40–45 minutes (vesicle formers) or 30 minutes (pit formers).
Antagonist dose-inhibition assay
Step 1. Plate cells at 4,500 cells/well in 23 µL of U2OS media. Incubate overnight at 37°C, 5% CO2.
Step 2. Prepare a 175 nM 3.5X isoproterenol stimulation solution by diluting the 175 µM isoproterenol stock 1:1000 in the ascorbic acid media.
Step 3. Perform ten five-fold serial dilutions of the propranolol stock solution in MEM with Hepes to form a series of 12.5X propranolol dose-inhibition solutions. Use MEM/Hepes alone as a negative control. (See Table 2.)
Table 2. Concentrations of the Propanolol 12.5X Solutions Required for the Antagonist Dose-Inhibition Assay
Step 4. Add 2 µL of the appropriate 12.5X propranolol dose-inhibition solution or negative control to each well.
Step 5. Incubate at 37°C, 5% CO2 for 30 minutes.
Step 6. Add 10 µL of the 175 nM isoproterenol stimulation solution or ascorbic acid media (unstimulated control) to each well.
Step 7. Incubate at 37°C, 5% CO2 for 40–45 minutes (vesicle formers) or 30 minutes (pit formers).
Sample fixing and staining
Step 1. Stop assay by adding 35 µL 4% methanol-free formaldehyde to each well. Cover and incubate for 45 minutes at room temperature.
Step 2. Wash each well with 50 µL DPBS.
Step 3. Add 8 µL of 0.05 mg/mL DAPI to each well. Incubate at room temperature for 15 minutes
Step 4. Rinse wells twice with 75 µL DPBS, leaving in 75 µL DPBS.
Step 5. Cover plate with a plate seal and store at 4°C, protected from light, until image acquisition.
Image acquisition
Step 1. Using MetaXpress Software, acquire unbinned images on an ImageXpress 5000A or Discovery-1 imaging system using DAPI and FITC filter sets and a 20x Plan Fluor or Plan Fluor ELWD objective. The results described here were obtained from imaging two sites per well.
Image analysis
Step 1. In MetaXpress Software, retrieve your images of interest from the database and analyze them with the Transfluor Assay Application Module. Select the appropriate source images, minimum and maximum widths, and intensity above local background for both the pit/vesicle staining and the nuclear staining.
Step 2. In AcuityXpress Software, annotate your plates with the appropriate compounds and concentrations.
Step 3. Create a dataset containing your plates of interest and perform curve fitting to obtain EC50 and IC50 values for each compound.
Assay Results
U2OS cells expressing beta-arrestin-GFP and either wild-type β2AR (pit formers) or enhanced β2AR (vesicle formers) were treated with either isoproterenol (agonist) or propranolol (antagonist). The enhanced β2AR has a modified C-terminal tail to increase its affinity for beta-arrestin, resulting in fluorescent vesicle formation.
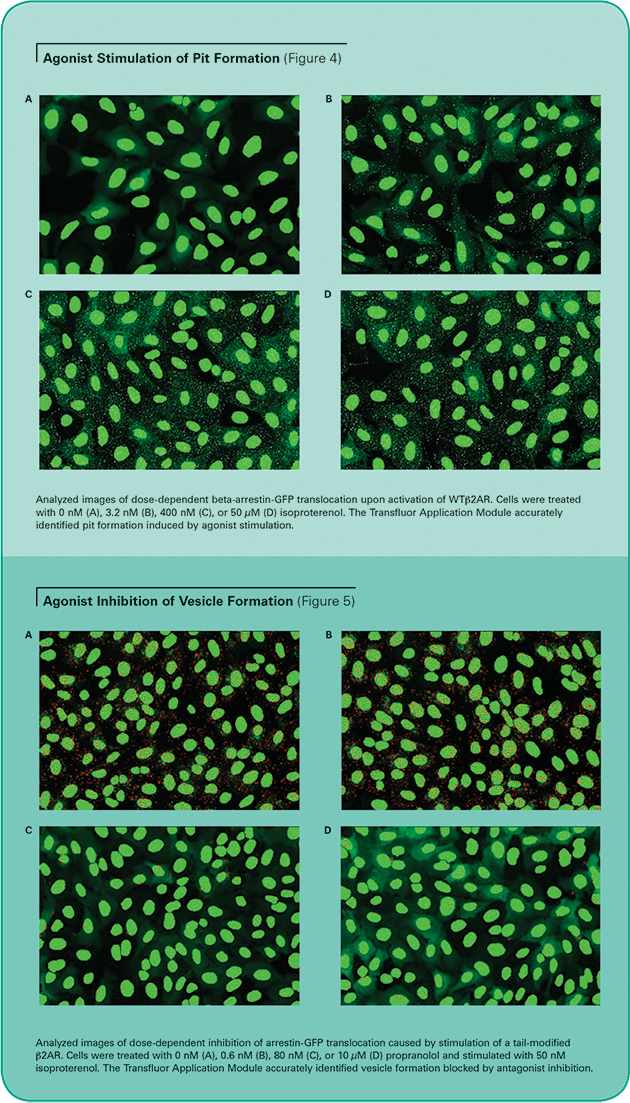
Images were acquired on an ImageXpress 5000A System as described above, and analyzed with the Transfluor Application Module. Similar results were obtained on a Discovery-1 System (data not shown). The accuracy of the module is illustrated in Figure 4 (pit phenotype) and Figure 5 (vesicle phenotype). The images show that the algorithm properly identifies pits and vesicles in either phenotype for cells stimulated with varying concentrations of the agonist isoproterenol. Unstimulated cells display minimal pits or vesicles.
Dose-response and dose-inhibition analysis
In both pit- and vesicle-forming cell lines, the dose-response of the agonist isoproterenol and the dose-inhibition of the antagonist propranolol were measured with the MetaXpress Software Transfluor Application Module. Each dose was run across six replicate wells. Figure 6 shows a plate heat map generated by AcuityXpress Software, demonstrating the dose-dependent response of the assay
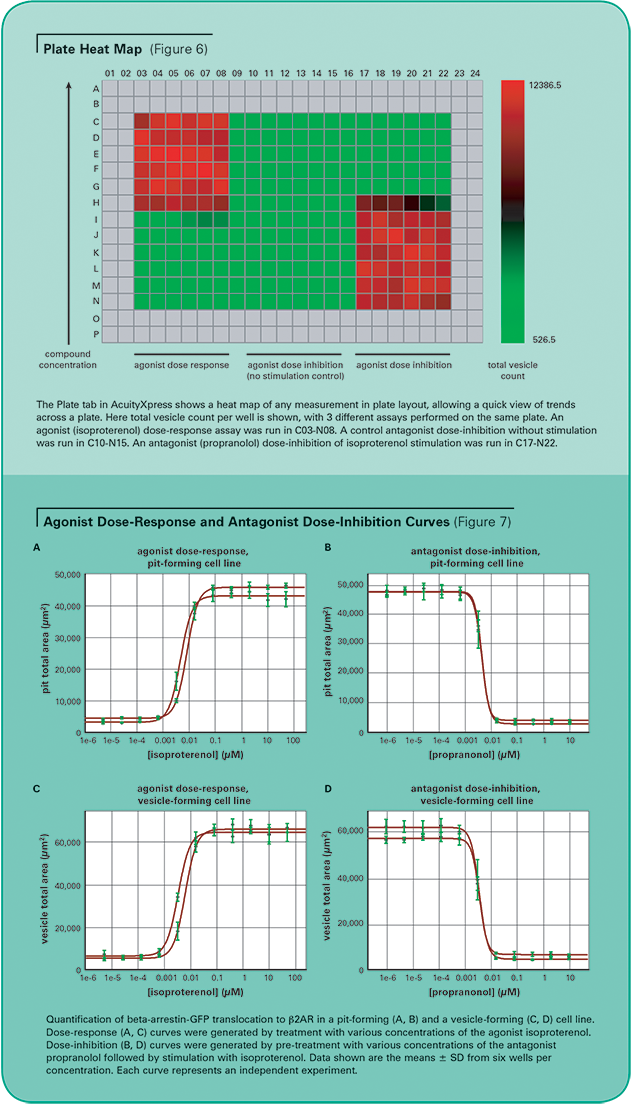
For EC50 and IC50 calculations, Hill curve fitting was performed on pit or vesicle area per cell, averaged across all replicate wells on the plate, plotted against compound concentration. AcuityXpress automatically generates curve fits for your entire dataset, encompassing multiple compounds and multiple plates, if appropriate. (See Figure 7.) Table 3 provides a summary of the agonist EC50 and antagonist IC50 for both cell lines from two independent experiments. These values correspond well to reports in the literature2 of isoproterenol stimulation of the beta-2-adrenergic receptor with an EC50 of 1–10 nM and propranolol antagonism with an IC50 = 0.5–5 nM.
Table 3. Measured EC50 and IC50 Values for Beta-2-Adrenergic Receptor Stimulation and Inhibition
Assay statistical summary
The Z' factors (see Table 4) were calculated for both experiments.3 The Z' factor, a measure of assay quality, reflects both the data variation and the signal dynamic range. The Z' factors measured for this experiment are > 0.6, easily within the desirable range for a cell-based imaging assay.
Table 4. Z' Statistical Summary for Agonist Stimulation and Antagonist Inhibition
Discussion
The MetaXpress Software Transfluor Application Module successfully identifies cells and measures pits and vesicles formed by beta-arrestinGFP translocation to activated GPCRs in the Transfluor Assay. Independent experiments with the beta-2-adrenergic receptor, both wild-type and enhanced, produce consistent EC50 and IC50 values with high Z' factors. These results demonstrate that the Transfluor Assay as analyzed by MetaXpress Software is a highly robust and reproducible assay for GPCR activation.
The rapid acquisition, analysis and data visualization capabilities of MetaXpress and AcuityXpress Software combined with the universality of the Transfluor Assay offer a uniquely powerful approach for screening GPCR modulators
References
- Oakley, R.H., Hudson, C.C., Cruickshank, R.D., Meyers, D.M., Payne, R.E. Jr., Rhem, S.M., Loomis, C.R. The cellular distribution of fluorescently labeled arrestins provides a robust, sensitive, and universal assay for screening G-protein-coupled receptors. Assay Drug Devel Tech 2003;1:21–30.
- Oakley, R.H., Laporte, S.A., Holt, J.A., Barak, L.S., Caron, M.G. Association of beta-arrestin with G-protein-coupled receptors during clathrin-mediated endocytosis dictates the profile of receptor resensitization. J Biol Chem 1999;274:32248–32257.
- Zhang, J.H., Chung, T.D., Oldenburg, K.R. A simple statistical parameter for use in evaluation and validation of high throughput screening assays. J Biomol Screen 1999;4:67–73.
Learn more >>