
Application Note
Multi-parameter imaging assay for measuring toxicity in a tumor model
- Screen spheroids with confocal optics
- Avoid disturbing cells with a no-wash protocol
- Test a spheroid in every well
- Multiplex fluorophores without increasing assay steps
Introduction
There is an increasing interest in using three-dimensional (3D) spheroids for modeling cancer and tissue biology to accelerate translational research. The goal of this study was to develop high-throughput, high-content imaging and analysis methods to characterize phenotypic changes in human cancer spheroids in response to compound treatment. Spheroids are believed to mimic tumor behavior more effectively than standard two dimensional (2D) cell cultures because, much like tumors, they contain both surface-exposed and deeply buried cells, proliferating and non-proliferating regions, and a hypoxic center with a welloxygenated outer layer of cells. Such 3D spheroid models are being successfully used in screening environments for identifying potential cancer therapeutics. Optimized spheroid cell culture protocols use U-bottom 96- and 384-well plates with a one-step staining procedure that reduces assay time and minimizes variability. We used a Maximum Projection algorithm that combines cellular information from multiple slices through a 3D object into a single image, enabling efficient comparison of different spheroid phenotypes. A custom image analysis method was implemented to provide multi-parametric characterization of single cell and spheroid phenotypes. Various phenotypic readouts allow quantitation of marker-specific cell numbers, measurement of cell viability and apoptosis, and characterization of spheroid size and shape.
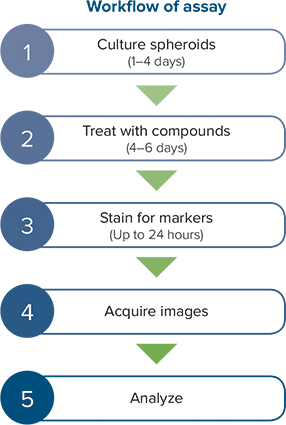
Culture spheroids

We used the following method to form spheroids from human cancer cell line HCT 116. Cells were cultured in flasks at 37°C and 5% CO2 before lifting and seeding into 96 or 384-well Corning U-shaped black clear bottom plates (Corning 4520 and 3830, respectively) at densities of 1000–1500 cells/well in media supplemented with Fetal Bovine Serum (FBS).
Treat with compounds

Drug treatment commenced 24 hours after spheroid formation by dispensing compounds into the wells at 10X concentration then incubating for an additional 4–6 days. Compound was re-added every 2 days at a 1X concentration.
Stain for markers

After the compound treatment was completed, stains (Table 1) were combined into a single cocktail at 4–6X concentration and added directly to the media. Stains that require no washing out were chosen to avoid disturbing the spheroids. A multi-parameter toxicity assay indicating the percentage of live and dead cells was used to determine effects of the anti-cancer compounds.
Table 1: Staining conditions for the toxicity assay.
Acquire images

In order to analyze responses of cells throughout the 3D structure, the ImageXpress® Micro Confocal High Content System was used to collect images from different depths within the body of the spheroid. MetaXpress® High- Content Image Acquisition and Analysis software then combined or collapsed that stack of images into a single 2D projection image using a mathematical algorithm. In this case an image was generated using Maximum Projection, where the pixels with the brightest intensity in the stack are kept in the 2D projection image (Table 2).
Table 2. Optimized acquisition parameters for the toxicity assay.
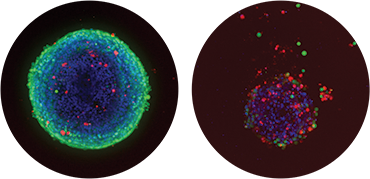
Figure 1. Overlaid image acquired using 10X objective showing control spheroid (left) and spheroid treated with 300 nM Mitomycin C (right). Nuclei (Hoechst stain) blue; live cells (calcein AM) green; dead cells (Ethidium Homodimer) red.
Analyze

Quantitative analysis of the images included derivation of parameters to assess morphological features of spheroids, cell content and complexity. Compound treatment may decrease spheroid size or width. Confocal spheroid imaging enables accurate counting and scoring of individual cells. We reported the total number of cells in the image, the number of calcein AM-positive cells (Live), and the number of Ethidium Homodimer (EthD-1) positive cells (Dead), as well as the average areas and intensities of cells expressing different markers. We have used MetaXpress software’s Custom Module Editor for multi-parametric image analysis to quantify different biological outputs (Figure 2). The analysis algorithm defined spheroids in the Hoechst image, scored cells as “Live” using Calcein AM and Hoechst staining, and scored cells as “Dead” using colocalization of EthD-1 and Hoechst (Figure 3).
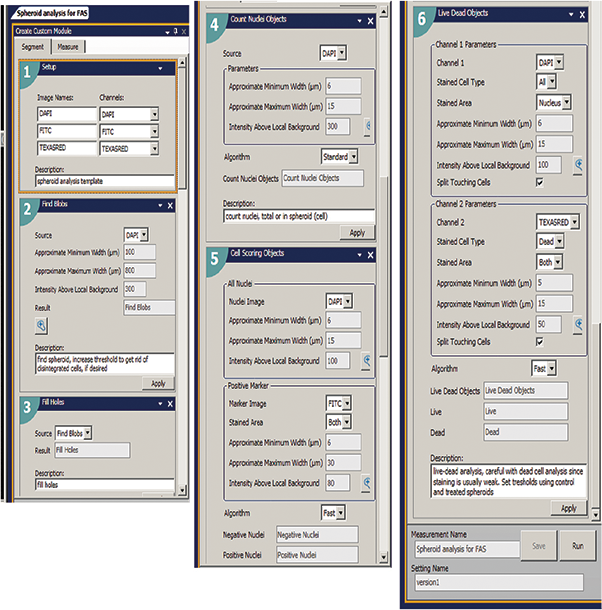
Figure 2. A Custom module was used to first identify the spheroid using an image of the nuclei in the DAPI channel. This way the spheroid size could be recorded as well as the number of the total, live or dead cells both within the spheroid and in the entire field of view. Then images were analyzed using Count Nuclei module to identify total number of cells; Cell Scoring module to define number of metabolically active Calcein AM positive cells; and Live-Dead analysis module identifying numbers of live (EthD-1 negative) and dead (EthD-1 positive) cells.

Figure 3. Segmentation masks showing identification of spheroids in teal and live nuclei in red. Control spheroid is on the left. Spheroid on the right, treated with 300 nM Mitomycin C, shows decreased number of live cells and a reduced spheroid size.
Results from a representative experiment are shown in Figure 4. Wells were seeded at 1500 cells per well, treated with different concentrations of 4 compounds after 24 hours, and then incubated with compounds for an additional 6 days. The compounds used were: Paclitaxel, Etoposide, Staurosporine, and Mitomycin C. Live spheroids were stained, imaged and analyzed as described above. A concentration-dependent decrease of spheroid sizes can be observed as a result of compound treatment, as well as decrease of cell number and a loss of cell viability.
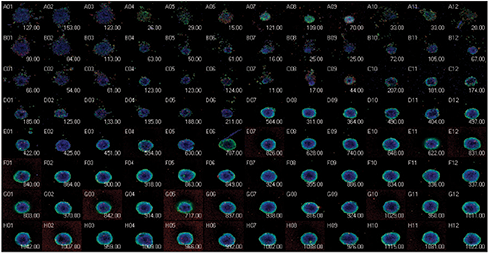

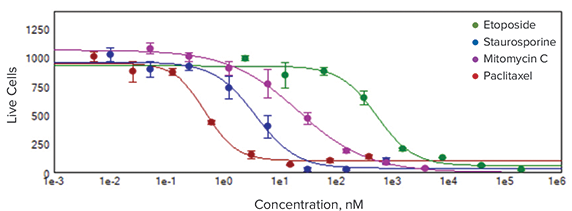
Figure 4. Thumbnail view of spheroid assay in the 96-well plate format (top). Concentrations of compounds increased from bottom to the top. Number of live cells displayed in the heat map in MetaXpress software clearly shows the dose responses of 4 compounds (middle). IC50 curves allowed comparing the potencies of selected compounds (bottom): paclitaxel, 0.49 nM; staurosporine, 3.7 nM; Mitomycin C, 21.8 nM; etoposide, 537 nM.
Conclusion
The ability of in vivo 3D culture systems to produce human cancer cell spheroids of uniform size, and the ability to screen spheroid response to treatment using high-throughput imaging is a significant step in facilitating relevant testing of chemotherapeutic drug candidates. The ImageXpress Micro Confocal Imaging System and MetaXpress software allow rapid imaging and analysis for monitoring cytotoxicity of anti-cancer drugs in a 96- or 384-well format.
For further information on optimizing acquisition parameters of these spheroid screening assays, refer to the paper: Sirenko, O. et al., High-Content Assays for Characterizing the Viability and Morphology of 3D Cancer Spheroid Cultures. Assay and Drug Development Technologies, 2015;13:402-414.
Learn more about the ImageXpress Micro Confocal High-Content Imaging System >>