
Application Note
Neurite outgrowth analysis in 3D reconstructed human brain micro-tissues
- Create robust image analysis of complex structures using built-in neurite analysis modules
- Tailor analysis algorithms and improve downstream results with an easy-to-use and flexible custom module editor
- Create brain models using 3D reconstruction tools
Introduction
Zhisong Tong | Research Scientist | Molecular Devices
Paul Adlard | Chief Scientific Officer | Tessara Therapeutics
Organotypic 3D cultures resemble native 3D tissue architecture and are believed more representative of real tissues than their 2D (monolayer) counterparts, thus providing higher in vivo relevance. A variety of 3D culture constructs have emerged as next generation in vitro cell culture models, including 3D bioprinted scaffolds, organ-ona-chip, microfluidics-based 3D cell culture models, and stem cell-derived organoids and spheroids. Among which, Tessara Therapeutics is taking 3D organotypic cultures to the next level with its novel RealBrain® drug screening platform which features human 3D mimetic neural micro-tissues.
These micro-tissues are generated by encapsulating primary or induced pluripotent stem cell (iPSC)-derived neural precursor cells in a proprietary hydrogel matrix composed of chemically defined biomaterials. This provides the optimal micro-environment to activate natural, endogenous programs of neurodevelopment in vitro. The developing cells proliferate, remodel their micro-environment, migrate, self-organize in 3 dimensions, and replace the synthetic hydrogel with their cell-secreted extracellular matrix (ECM). Furthermore, the high optical clarity of the matrix makes these micro-tissues ideally suited to high-content imaging applications.
To assess the complexity of neural networks, it is important to quantify the extent of neurite outgrowth. Developing neurons produce new projections as they grow and integrate into a neural network. A micro-tissue that models the neuronal development should show highly interconnected neurons. Visualization of these complex biological samples—at scale—requires high-content image acquisition and analysis with a tightly orchestrated and integrated workflow that can reconstruct 3D images.
In this application note, we imaged 3D neural micro-tissues stained with fluorescent markers using ImageXpress® Micro Confocal High-Content Imaging System. We then reconstructed them in 3D and developed a method to quantify the number of neurons and the extent of their respective outgrowths using MetaXpress® High-Content Image Acquisition and Analysis Software. With this approach, we found that the number of neurites is proportional to the number of cell bodies and the number of nodes. This type of analysis can be used in a range of applications, such as assessing the effects of compounds on neurons and neural networks.
MetaXpress Custom Module Editor workflow
MetaXpress Custom Module Editor (CME) has built-in modules to perform certain analysis tasks based on traditional image processing. It is comprised of two module categories: one that serves to find objects from images and the other to modify objects and mages. The “object” is the mask that marks regions of certain biological samples of interest. The category I modules can be further divided into 2D modules, which identify objects in certain Z-plane–or 2D projection images, and 3D modules, which identify objects in a volumetric manner. The representative 2D modules are neurite outgrowth objects, cell scoring objects, angiogenesis objects, etc., serving different Figure 1. Classification of CME modules. analytical purposes. The category II modules can be regrouped into modules modifying objects and modules modifying images. The representative modules that modify objects are filter mask, grow objects, and connect by best match, the latter of which generates 3D objects from 2D objects by best match. Also, the modules that modify images range from simple operations like add, multiply and maximum to more complicated algorithm filters, such as top hat, Gaussian, and LoG, which are powerful building blocks for customized algorithms for deeper analysis.
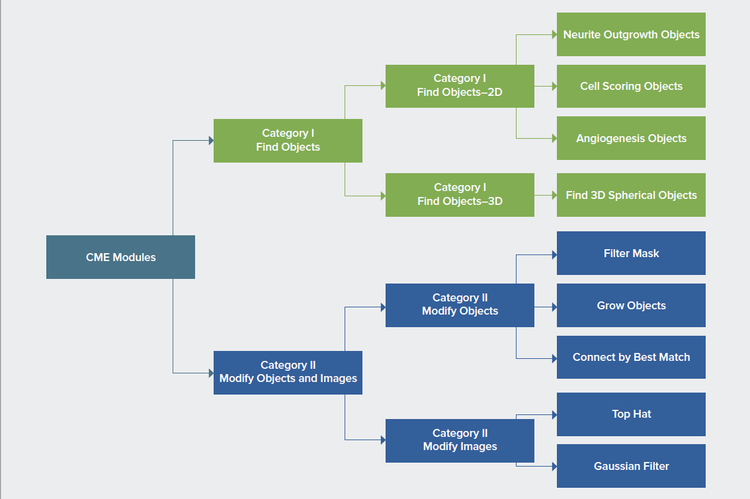
Figure 1. Classification of CME modules.
Neurite outgrowth objects can be used to generate masks identifying all the cell bodies and neurites
By setting up the neurite and nuclear channels and specifying the related parameters for cell bodies and outgrowths, we generated the mask for both the cell bodies and outgrowths.
Further post-processing is then necessary to count individual neurites, cell bodies, and nodes, where nodes are defined as dots with two or more neurites intersecting. Using the modules that modify objects and images, the process could be divided into three steps. Step one, we used the shrink objects module to eliminate the line masks for outgrowth and kept the remaining masks for cell bodies (Figure 3A–3B). Step two, we used the subtract module to eliminate the generated cell bodies mask from the original overall mask and kept the remaining masks for outgrowth. Step three, we used the average filter as a simple approach to achieve the mask for the nodes where nodes show relatively higher pixel values than that of lines (Figure 3C–3D). Step four, we eliminated the nodes from the masks of outgrowth obtained from step two (Figure 3E–3). What was left are the individual outgrowth lines used for counting.
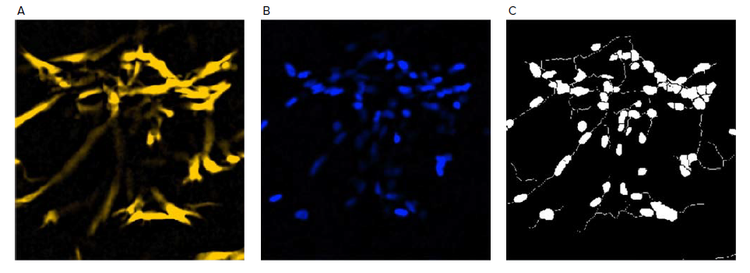
Figure 2. Examples of neurite outgrowth analysis. A) Tubulin staining of micro-tissue served as the neurite channel where approximate maximum width, intensity above local background, and minimum area are specified for cell bodies. In addition, approximate maximum width, intensity above local background, and minimum cell outgrowth to consider significant are specified for outgrowths; B) DAPI staining of micro-tissue served as the nuclear channel where approximate minimum width, approximate maximum width, and intensity above local background are specified; C) The generated mask containing objects for both cell bodies and neurite outgrowth.
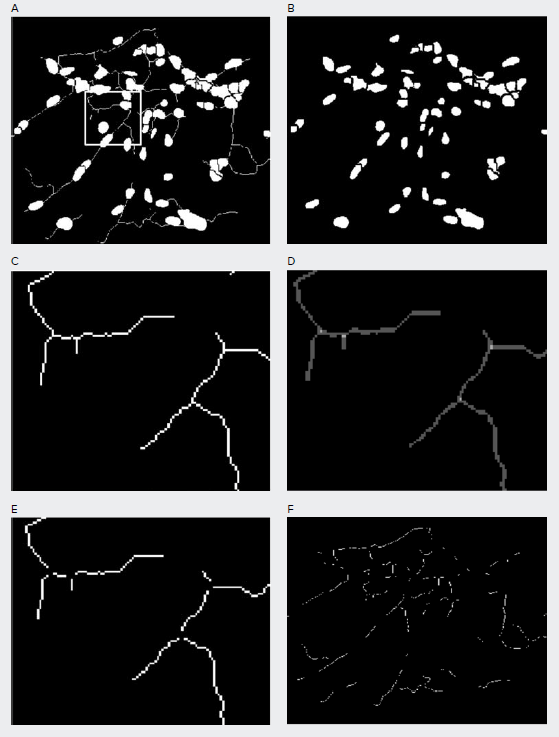
Figure 3. Masks generated to identify individual cell bodies and individual neurite outgrowth. A) The overall mask generated from the module neurite outgrowth objects; B) The mask of cell bodies created by eliminating the line masks from A) using the shrink objects module; C) The zoomed in box region in A) of the line mask by eliminating mask B) from mask A) using subtract module; D) The location of nodes are located using the average filter module; E) The zoomed in region of the individual neurite outgrowth mask by eliminating the nodes from mask C); F) The overall mask of individual neurite outgrowth.
The counts of cell bodies, neurites and nodes, and measurements of neurite length
The 3D objects of cell bodies, neurites and nodes were generated by best match module and the number of cells bodies, neurites and nodes, respectively, per well were counted. The linear regression of the number of neurites against the number of cell bodies shows an average of 1.97 neurites per cell body and the linear regression of the number of neurites against the number of nodes shows an average of 2.62 neurites per node, as shown in Figure 4A and 4B. This linear relationship indicates the robustness and consistency of our analysis algorithm generated from CME. In Figure 4C, the volume of the organoid shows linear relationship with the total length of all neurites as expected.
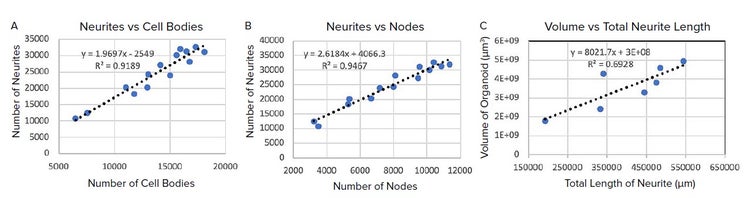
Figure 4. Graph showing number of neurites per well vs number of cell bodies per organoid; B) Graph showing number of neurites per organoid vs number of nodes per organoid; C) Graph showing the volume of the organoid vs the total length of all neurites.
3D visualization of human brain micro-tissues
3D visualization of brain micro-tissues can be rebuilt using the 3D reconstruction tool which can be used to rotate or view structures from different angles and export reconstructed images into movie format. In Figure 5, we show the image of the whole brain micro-tissue after 3D reconstruction.
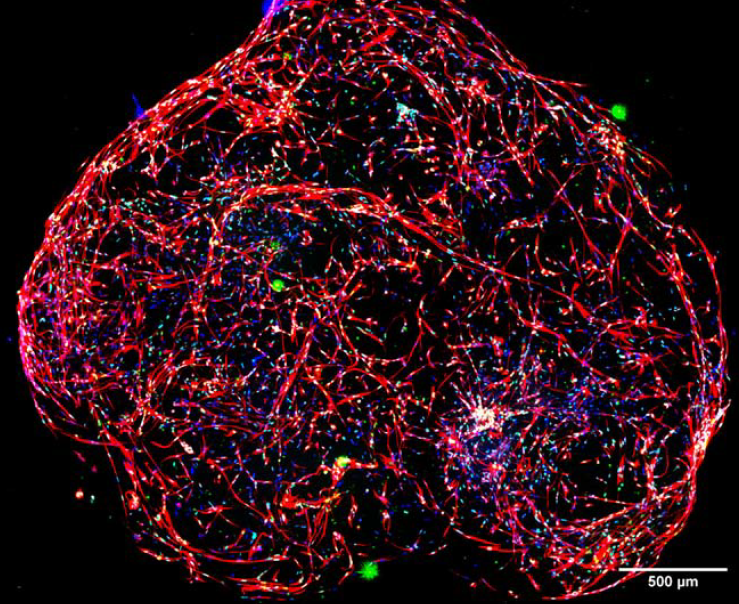
Figure 5. 3D reconstruction of micro-tissue using the 3D reconstruction tool in MetaXpress. Red: Tubulin, Green: SOX2, Blue: nuclei
Conclusion
- We leveraged CME’s built-in modules to find and modify objects and images, customize analysis algorithms, and gain deeper insights.
- We reconstructed samples taken at different z layers and wavelength channels into a more informative 3D brain model.
- We also successfully developed an algorithm to analyze the neurites, nodes, and cell bodies from a human brain micro-tissue and reconstructed the 3D model.
- This innovative combination of high-content imaging with 3D human neural micro-tissues has significant potential to reveal greater mechanistic insights during industrial drug-screening programs.