
Application Note
Homogeneous High-Throughput Live Cell GPCR Binding Assay
For Live Cell Screening
Introduction
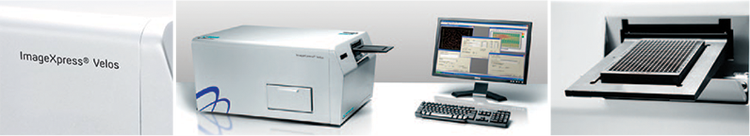
Molecular Devices has developed a powerful new screening platform, the ImageXpress® Velos System , for multiparametric screening of cells in multi-well plates using fluorescence measurements. The ImageXpress Velos System optics, with a confined detection region limits the region from where fluorescence is collected to near the sample plane where the adherent live cells are located. This reduces background fluorescence and improves the measurement of cell bound signals. The system can collect clear images across a full plate without the need to focus and scans a whole plate in 120 seconds at a resolution of 10 microns regardless of the plate well density. These features make the ImageXpress Velos System ideal for a highthroughput live cell binding assay
In this report the ImageXpress Velos System laser scanning platform was used to demonstrate a live cell binding assay of Cy3-labeled telenzepine (Cy3-TP) to Chinese hamster ovary (CHO) cells expressing M1 muscarinic acetylcholine receptors. Selectivity was evaluated using atropine to demonstrate specific binding as well as competition and displacement of the Cy3-labeled non-peptide ligand from this important class of G Protein-Coupled Receptors (GPCRs).
Assay Procedure
Cell Seeding and Cy3-TP Binding Assay Procedure. The live cell binding assay was performed in 96-well black walled Packard View plates. Plates were seeded with CHO cells expressing M1 muscarinic acetylcholine receptors (cells and reagents provided by Amgen (Thousand Oaks)). The multi-well plates were incubated at 37oC in a 5% CO2 incubator before use. The cell binding reactions were carried out at room temperature in using the 96-well plates.
On-Rate Procedure. For the on-rate studies the cells were exposed to 40 μl containing alone or with 2 μM atropine followed by 40 μl of 10 nM (final concentration) of Cy3-TP. Note, the final atropine concentration was 1 μM. The plate was scanned every 5 min for the first 30 min and every 10 min thereafter up to 135 min.
Selectivity of Cy3-TP Binding. The cells were exposed to 40 μl of the indicated concentration of atropine followed by 40 μl containing 8 nM Cy3-TP. This resulted in a final concentration of 4 nM for the competition studies. The plate was scanned after 60 min of binding.
Detection of Cy3-TP Binding. The ImageXpress Velos System laser scanning platform was setup for 1-channel acquisition of Cy3 fluorescence using Ch3 with a 560-610nm (orange) band pass filter. The image acquisition was done at 5 x 5 micron sampling and an entire 96-well plate was scanned.
Live Cell Staining and Detection of CMFDA. The live cell fluorophore 5-chloromethylfluorescein diacetate (CMFDA) was obtained from Invitrogen (Carlsbad, CA) and used at 0.1 μM to label cells after the binding reaction. Briefly, a 2X solution of CMFDA was prepared in buffer and 80 μl was added to the binding reaction in each well; this resulted in a final volume of 160 μl/well of 0.1 μM CMFDA. The cells were incubated with CMFDA for 30 min at room temperature and then scanned using the Ch1 510-540nm (green) band pass filter. The image acquisition was done at 5 x 5 micron sampling and an entire 96-well dish was scanned.
Results & Discussion
On-Rate Results. Cells were seeded at 5000 cells/well and selected wells were exposed to 40 μl containing binding buffer alone or with 2 μM atropine followed by 40 μl of 10 nM final concentration of Cy3-TP. The plate was scanned on the ImageXpress Velos System system at multiple time points in a homogeneous format. Representative images of the binding time-course of cells incubated with 10 nM Cy3-TP are shown in Figure 1 (top panel). The Cy3-TP response was evaluated by defining a 4 mm diameter region of interest (ROI) in the center of each well, thresholding on the Cy3 signal within that ROI, integrating the total amount of Cy3 fluorescence, and subtracting the background signal value (signal not above threshold within the ROI). Excellent discrimination was observed between positive (no atropine (Atr)) and negative (1 μM Atr) controls using 10 nM Cy3-TP for the binding reaction (Figure 1).
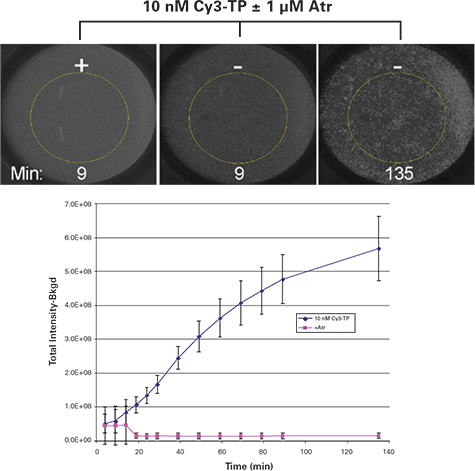
Figure 1.
Top panel: ImageXpress Velos System images of homogeneous Cy3-TP binding assay for wells incubated with the indicated concentrations of Cy3-TP. The yellow circle is the 4 mm ROI used for image analysis. Bottom graph: Results for homogeneous Cy3-TP binding assay. Values represent mean and standard deviation of 4 replicates at each condition. (Atr = atropine)
Selectivity of Cy3-TP Binding. The atropine concentration response curve for the homogeneous Cy3-TP binding assay was evaluated in the homogeneous assay format. A clear trend with atropine concentration was observed, however, saturation of the signal at low atropine concentrations was not found, suggesting that a method for cell normalization would improve the binding assay. In order to normalize to total cell count, the cells were fixed in PBS containing 3.7% formaldehyde, and then stained with 0.1 μg/ml propidium iodide (PI). The plate was scanned and the PI signal was collected in a separate channel using a 650nm long pass filter. This provided excellent discrimination from the Cy3 signal. Cells were identified by thresholding on the PI signal and then the background subtracted average Cy3 response was calculated. This provides a normalized Cy3-TP response for the whole well. The atropine response curve determined in this fashion is shown below in Figure 2 for the ten atropine concentrations and one blank (plotted at 0.016nM for clarity).
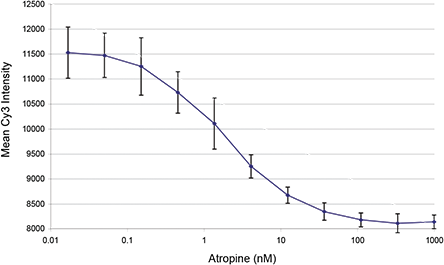
Figure 2.
Atropine concentration response curve for Cy3-TP binding assay with fixed & stained cells. Values represent average and standard deviation of eight replicates at each condition. No atropine control well value is shown at 0.016nM for clarity
CMFDA staining for Cell Normalization. A more efficient single step process of adding an equal volume of buffer containing a 2X concentration of CMFDA was demonstrated (Figure 3). After the binding reaction the cells were labeled with 0.1 μM CMFDA for 30 min at room temperature and the CMFDA signal was collected in a separate channel using a 510-540nm band pass filter. As shown in Figure 3 , the CMFDA-labeled cells were identified by thresholding on the CMFDA signal. Thus, the simple single step process allows the background subtracted average Cy3 response to be calculated and normalized for the cells in the whole ROI.
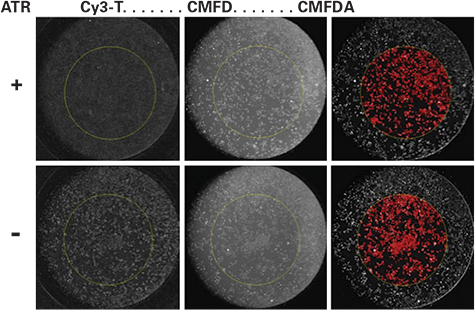
Figure 3.
Normalization of Cy3-TP binding to total cell count. The top panel shows a well that received 2 μM atropine versus a well with buffer alone (bottom panel) immediately before the addition of a solution containing 8 nM Cy3-TP. The binding reaction final concentrations are 1 μM atropine and 4 nM Cy3-TP. The images labeled Cy3-TP were obtained by scanning the plate after the binding reaction. The middle image is the CMFDAlabeled cells after 30 min room temperature incubation and before image processing. The right image shows the CMFDA-labeled cells after image processing and the red identifies the thresholded objects within the 4 mm ROI. The total area value was used for normalization of the Cy3-TP binding.
Off-Rate Results An off-rate study was performed with cells seeded at 2500 cells/well. The cells were incubated with 4 nM Cy3-TP for 1.5 h, followed by the addition of serial 1:3 dilutions starting at 100 nM atropine. The off-rate study was done in homogeneous fashion and data was collected at regular intervals over a two-hour time period. The percent change in Cy3-TP signal (relative to the 5 minute time point) was calculated and off-rate values were found to increase with atropine concentration as expected. A linear response for Cy3-TP signal decrease was found with high atropine concentrations (data not shown, manuscript in preparation).
Conclusions
In this report the ImageXpress Velos System laser scanning platform was used to demonstrate a live cell binding assay of Cy3-TP to CHO cells expressing M1 muscarinic acetylcholine receptors. Atropine was used to demonstrate specific binding as well as competition and displacement of the Cy3-TP. Whole well images were processed by an integrated image analysis program to generate competitive binding curves, on-, and off-rate results; suggesting straightforward development of automated processing routines for this application. To improve quality of the data due to the well to well differences in cell coverage in the ROI, a simple one step procedure to normalize to the total cell area was demonstrated. The results presented here show that the ImageXpress Velos System provides a foundation for a high-throughput platform for screening GPCRs in live cells in multi-well plates. The unique optics and scanning engine of this platform enables simple “plug and play” applications to meet the
">