
Application Note
Luminescent cell viability and cytotoxicity assays on the SpectraMax i3x Multi-Mode Microplate Reader
- Highly sensitive luminescence detection down to 10 cells per well
- Microplate and read height optimization wizards for best signal detection
- Preconfigured software protocols for faster analysis of results
Introduction
Molecular Devices SpectraMax® i3x MultiMode Microplate Reader, in combination with luminescent assays for cell viability and cytotoxicity, provides a sensitive and rapid way to measure the number of viable cells in culture and quantify the cytotoxic effects of experimental treatment. The CellTiter-Glo assay from Promega uses luciferase enzyme, which requires ATP in order to generate light. The luminescent signal produced in the assay depends on the amount of ATP in the culture, which in turn depends on the number of viable cells present. The Bioluminescence Cytotoxicity Assay Kit from BioVision is based on the measurement of adenylate kinase (AK), a ubiquitous protein present in all cells and released into culture medium upon loss of plasma membrane integrity. AK converts ADP to ATP, which is then detected via a luminescent reaction.
Materials
- CellTiter-Glo Luminescent Cell Viability Assay (Promega P/N G7570)
- Bioluminescence Cytotoxicity Assay Kit (BioVision P/N K312-500)
- HeLa cells (ATCC P/N CCL-2)
- Black/clear 96-well tissue culture plates (Corning P/N 3904)
- Solid white 96-well tissue culture plates (Corning P/N 3917)
- Solid white 384-well tissue culture plates (Greiner P/N 781080)
- SpectraMax i3x Multi-Mode Microplate Reader
Methods
Preparation of reagents
CellTiter-Glo Buffer and substrate were thawed and equilibrated to room temperature prior to use. The contents of the bottle of CellTiter-Glo Buffer were transferred into the amber bottle containing CellTiter-Glo Substrate, and the contents were mixed by gentle inversion as directed in the kit’s technical bulletin.
For the Bioluminescent Cytotoxicity Assay Kit, a vial of AK Detection Reagent was reconstituted with 1.1 mL of AK Assay Buffer, mixed gently, and allowed to equilibrate at room temperature for 15 minutes. This AK Stock Reagent was then diluted 10-fold into Assay Buffer to make the AK Detection Reagent Working Solution.
Correlating cell numbers with luminescent signal
HeLa cells were cultured in MEM supplemented with 10% fetal bovine serum penicillin/streptomycin. Cells were trypsinized, suspended in culture medium, and counted. For the 96- well assay format, serial cell dilutions from 50,000 to 10 cells per well were plated at 100 µL of cell suspension per well. For the 384-well format, serial cell dilutions from 12,500 to 6 cells per well were plated at 25 µL per well. Control wells containing medium without cells were prepared to obtain background luminescence values.
To ensure accurate cell numbers for the cell standard curves, cells were assayed immediately. 100 µL (96-well assay) or 25 µL (384-well assay) of CellTiter-Glo reagent was added to each well. The plate was mixed gently for 2 minutes on a plate shaker and then allowed to incubate at room temperature for 10 minutes to stabilize luminescence.
ATP standard curves
A 1:10 dilution series of ATP was set up in solid white 96- and 384-well plates at concentrations from 10 uM down to 1 nM, along with blank wells containing no cells. The CellTiter-Glo assay was used to measure ATP. Microplate optimization and read height optimization were performed for best results.
Cell viability and cytoxicity assays
HeLa cells were seeded at 15,000 cells per well in 96-well solid white or clear-bottom tissue culture-treated microplates and allowed to attach and grow overnight. The next day staurosporine and anisomycin were added to the cells to induce apoptosis. Compounds were added as a 1:2 dilution series starting at a top concentration of 50 µM and going down to 24 nM. After 24 hours of treatment with compounds, cells were assayed with the CellTiter-Glo and BioVision Cytotoxicity kits.
For the cell viability assay, 100 µL of CellTiter-Glo reagent was added to each well of the solid white plate containing treated cells. The plate was read about 10 minutes after reagent addition to allow for cell lysis.
For the BioVision cytotoxicity kit, 100 µL of culture medium was removed from each treated well and transferred to a solid white plate. 100 µL of AK Reagent Working Solution was added to each well, and the plate was read within 30 minutes.
Instrument setup and sample analysis
SpectraMax i3x reader settings were configured as indicated in Table 1.
Calculations of average RLU and standard deviations, graphing of cell dilution series and ATP standard curves, and 4-parameter curve fitting for IC50 curve generation were performed using SoftMax® Pro Software. A preconfigured protocol for the CellTiterGlo assay is included in the software’s protocol library.
96 Well Costar clear
384 Well Greiner clear*
Integration Time: 1000 ms
Read Height: 5.86 to 8.09 mm (assay dependent)**
*The 384-well microplate plate definition was optimized using the Microplate Optimization Wizard in SoftMax Pro Software.
**Read height was optimized for each assay using the Read Height Optimization Wizard to ensure optimal signal detection.
Table 1. Instrument settings for luminescence readings.
Results
The SpectraMax i3x reader was able to detect as few as 10 cells per well in both 96-well and 384-well assay formats. Cells can thus be measured at numbers below the detection limits of standard colorimetric and most fluorometric methods. The CellTiter-Glo assay was linear over the entire range of cell concentrations used, spanning greater than three orders of magnitude with r2 > 0.99 (Figure 1).
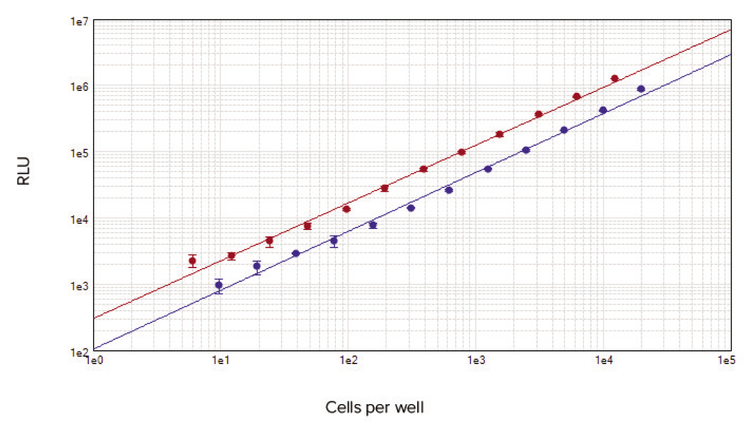
Figure 1. Cell standard curves for 96-well (blue circles) and 384-well (red circles) assay formats are shown. In each format, cell numbers at least as low as 10 cells per well can be detected. For both standard curves, r2 > 0.99.
ATP standard curves can be used to verify assay performance and calculate cellular ATP content. Here, luminescent signal from ATP standards ranging from 1 nM to 10 uM covered the entire range of luminescence output observed in the numbers of cells assayed here (Figure 2). Measurements were linear over at least four decades.

Figure 2. ATP standard curves for 96-well (red circles) and 384-well (green circles) assay formats are shown. For both standard curves, r2 = 0.999.
Cells treated with the compounds staurosporine and anisomycin were assayed for cell viability by measuring ATP levels (Figure 3), and for cytotoxicity by assaying for the enzyme adenylate kinase (Figure 4). Both assays yielded similar IC50 values for staurosporine (0.34 µM and 0.15 µM, respectively) and for anisomycin (3.30 µM and 2.28 µM).
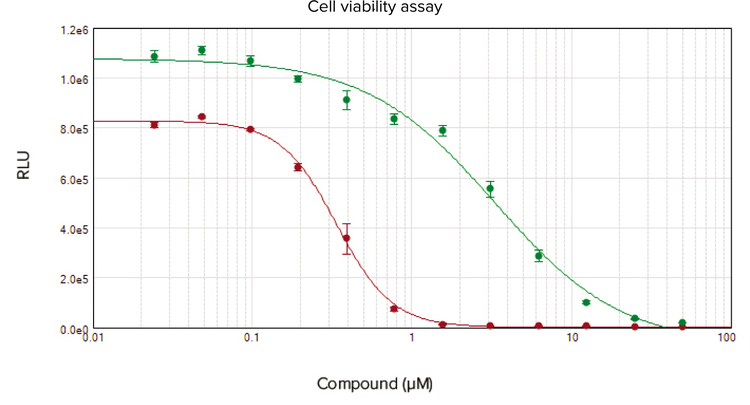
Figure 3. Concentration-response curves for HeLa cells treated with staurosporine (red circles) and anisomycin (green circles) for 24 hours. The IC50 value for staurosporine was 0.34 µM, compared to 3.30 µM for anisomycin.
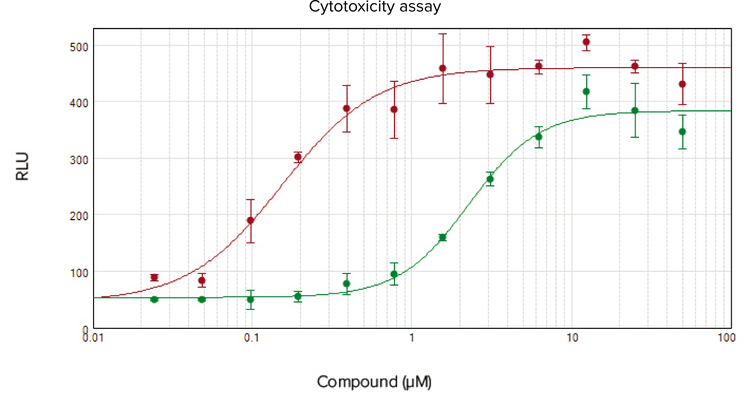
Figure 4. Concentration-response curves for HeLa cells treated with staurosporine (red circles) and anisomycin (green circles) for 24 hours. Cells were assayed for adenylate kinase activity using the BioVision Cytotoxicity Assay Kit. The IC50 value for staurosporine was 0.15 µM, compared to 2.28 µM for anisomycin.
Conclusion
The SpectraMax i3x reader offers excellent sensitivity in luminescence detection for ATP-based cell viability and adenylate kinase-based cytotoxicity assays, enabling detection of as few as 10 cells per well. Four-parameter curve fitting and calculation of IC50 values were all done within the SoftMax Pro Software. Microplate and read height optimization wizards ensure optimal signal detection and are automated by the software.
In addition to luminescence detection, the SpectraMax i3x reader gives users the capability of multiplexing the CellTiter-Glo and BioVision Cytotoxicity assays with other assays requiring additional detection modes. This multi-mode reader offers absorbance detection and fluorescence intensity detection with patent-pending Spectral Fusion™ Illumination to deliver wavelength flexibility while maximizing signal strength.
The ability to add user-exchangeable cartridges, including time-resolved fluorescence and western blot detection, and the optional SpectraMax® MiniMax™ 300 Imaging Cytometer module, expands the reader’s detection capability and enables application options far exceeding those of other readers. All instrument configurations are operated using SoftMax Pro Software, which contains preconfigured protocols for CellTiter-Glo and over 120 other assays to facilitate data collection and analysis.
Learn more about SpectraMax i3x Multi-Mode Detection Platform >>
简介
SpectraMax i3x是Molecular Devices公司 新推出的一款多功能微孔板读板机,可利 用仪器所具有的化学发光检测功能,进行 细胞活力和细胞毒性相应检测。仪器可灵 敏、快速检测出培养基中活细胞的数目和 经相应处理后细胞毒性情况。Promega公 司推出的CellTiter-Glo试剂是利用了萤火 虫荧光素酶反应体系中需要ATP参与才能使 其发光的特点,化学发光信号强弱取决于 培养基中ATP含量的高低,也就是依赖于其 中活细胞数目的多少。来自于BioVision公 司基于生物化学发光原理的细胞毒性检测 试剂盒,目的是检测腺苷酸激酶(AK)的含 量,AK为一种存在于所有细胞中的常见蛋 白,当破坏了细胞膜完整性后其会释放至 培养基中,AK可转化ADP至ATP,所以可 以利用类似方式进行化学发光检测。
材料
- CellTiter-Glo Luminescent Cell Viability Assay (Promega P/N G7570)
- Bioluminescence Cytotoxicity Assay Kit (BioVision P/N K312-500)
- HeLa 细胞(ATCC P/N CCL-2)
- 黑色底透 96孔细胞培养板 (Corning P/N 3904)
- 白色96孔细胞培养板(Corning P/N 3917)
- SpectraMax i3x多功能微孔板读板机
方法
准备试剂
使用前预先将CellTiter-Glo缓冲液和底物 解冻并且平衡其至室温,将CellTiter-Glo 缓冲液加至含有CellTiter-Glo底物的棕色 小瓶中,按照试剂盒说明书提示,将试剂 轻轻反复颠倒进行混匀。对于生物化学发 光细胞毒性检测试剂盒,其中包含了1瓶AK 检测试剂,此试剂使用前预先将1.1ml AK 试剂缓冲液加入其中并轻轻混匀,需在室 温环境下平衡15分钟后使用。这个10X的 AK试剂的储存液需要稀释后才能成为试剂 缓冲液。
细胞数目与化学发光信号关系
Hela 细胞培养在含有10%胎牛血清和双抗 的MEM培养基中,细胞经胰酶消化后,使 其悬浮于培养基中进行计数。处理后的细 胞铺在96孔板中,经细胞培养基稀释后其 密度从50,000细胞每孔/100μl至10个细胞 每孔/100μl。如果将细胞铺在384孔板时, 稀释后密度从12,500细胞每孔/25μl至6个 细胞每孔/25μl。对照孔中仅需加入细胞培 养基用于检测其背景的化学发光信号值。
细胞试验过程中,精确的细胞数目可用于生成标准曲线,将不同体积的CellTiter-Glo试剂加入相应的孔板中,如100μl(96孔孔板)或25μl(384孔板)。将微孔板放置于振荡器上轻混2分后,室温条件下孵育10分钟,等化学发光信号值稳定后再进行检测
ATP标准曲线
ATP以1:10稀释度进行稀释后加入96孔板 和384孔板中,浓度从10至1nM,不加细胞 的孔作为空白孔。CellTiter-Glo试剂可用于 检测ATP,检测前可利用SpectrMax i3x具 有的微孔板优化设置和读取高度优化设置 功能,帮助你获得更佳信号值。
细胞活力和细胞毒性试验
将Hela细胞预铺在白色底透的细胞培养型96孔板中,密度为15,000/孔,培养过夜。第二天在细胞孔中加入十字孢碱(staurosporine)和茴香霉素(anisomycin)这两种化合物来诱导细胞凋亡。这两种化合物起始浓度都为50μM,并以1:2方式稀释至24nM。再经过24小时孵育以后,分别使用CellTiter-Glo细胞活力检测试剂盒和BioVision的细胞毒性检测试剂盒对处理后的细胞进行检测。
对于CellTiter-Glo细胞活力检测试验,将100μl的CellTiter-Glo试剂加入含有细胞的白色微孔板中,等10分钟左右,当细胞彻底裂解以后再进行相应检测。
对于BioVision细胞毒性检测试验,每孔中取100μl处理后的细胞培养基,将其转移至白色微孔板中,并在白色微孔板中加入100μl的AK工作液,此方法需要在30分钟内完成检测。
仪器设置和结果分析
SpectraMax i3x读板机参数设置如表一所 示。使用专业级别的SoftMax® pro软件后, 可直接获得平均相对化学发光信号值(RLU) 和标准偏差值。直接绘制出细胞稀释度曲 线和ATP标准曲线,选择其中的4参数拟合 方式进行拟合后快速计算出其IC50值。软件 预置模板库中还有针对CellTiter-Glo检测 试验的模板可方便直接调用。
96 Well Costar clear
384 Well Greiner clear*
Integration Time: 1000 ms
Read Height: 5.86 to 8.09 mm (assay dependent)**
*The 384-well microplate plate definition was optimized using the Microplate Optimization Wizard in SoftMax Pro Software.
**Read height was optimized for each assay using the Read Height Optimization Wizard to ensure optimal signal detection.
表一:化学发光检测时如何设置读板机的参数
结果
SpectraMax i3x读板机针对96孔板和384孔 板进行检测时,最低检测下限可至10细胞 每孔。此种检测方法的灵敏度远远高于标 准比色法和绝大多数荧光法。CellTiter-Glo试剂检测线性范围覆盖所有细胞浓度区 区间,动态学检测范围大于3个数量级且r2 > 0.99(图一)
***图一:图中分别是96孔板的标准曲线(蓝色圆圈)和384孔板的标准曲线(红色圆圈),*在每种类型的 微孔板中,检测下限可至10个细胞每孔,两条曲线的标准方差值r2 > 0.99
ATP标准曲线既可以验证试验条件也可以用来计算细胞内ATP的含量。因此,ATP标准品浓度范围从1nM至10μM产生的化学发光信号范围可覆盖整个不同细胞数目孔中产生的信号值(图二),检测的线性范围大于四个数量级。
图二:96孔板中ATP标准曲线(红色圆圈)和384孔板中ATP标准曲线(绿色圆圈),两个标准曲线的r2 = 0.999。.
经十字孢碱(staurosporine)和茴香霉素(anisomycin)等化合物处理后细胞其活力的变化可通过检测ATP水平而实现(图三)。细胞毒性可以通过检测其AK量变化而实现(图四)。十字孢碱(0.34μM和0.15μM)和茴香霉素(3.30μM和2.28μM)两次处理试验获得相似的IC50值。
图三:Hela细胞经十字孢碱(红色圆圈)和茴香霉素(绿色圆圈)处理24小时后浓度效应学曲线,十字孢碱IC50值为0.34μM,茴香霉素IC50值为3.30μM。
图四:Hela细胞经十字孢碱(红色圆圈)和茴香霉素(绿色圆圈)处理24小时后浓度效应学曲线。使用BioVision细胞毒性检测试剂盒来检测细胞内AK活性变化,十字孢碱IC50值为0.15μM,茴香霉素IC50值为2.28μM。
结论
在利用SpectraMax i3x读板机化学发光检 测功能进行基于ATP变化的细胞活力和基于 AK变化的细胞毒性检测时其表现出了超高 灵敏性,检测下限可至10个细胞每孔。可 通过专业级别的SoftMax Pro 软件进行四参 数拟合,随后直接计算出IC50值。软件可以 自动优化微孔板的检测高度,可帮助用户 获得更好的信号值。
主机除了具有化学发光检测功能以外, SpectraMax i3x读板机可升级具有更多检 测功能以满足用户对不同试验的不同检测 需求。此仪器的光吸收和荧光强度检测功 能,光源采用了光谱融合技术(Spectra FusionTM Illmumination)使其既可以兼顾 了波长灵活性也可以获得更好的检测信号。
主机可加入具有新检测功能的卡盒,用户 自己可随时进行功能升级,包括时间分辨 荧光检测功能和Western Blot检测功能, 也可选配Spectra® MiniMaxTM 300细胞成像 模块,扩展此读板机检测能力和应用范 围。仪器所有功能均可以使用一种软件进 行操作,即专业级别的SoftMax Pro软件, 其中包含了CellTiter-Glo等近120预置检测 模板可方便用户自己快速进行数据收集和 数据分析。