
Application Note
Measure intrinsic tryptophan fluorescence on the SpectraMax iD3 microplate reader
- Sensitive fluorometric tryptophan detection for protein analysis
- Automated identification of peak shifts with spectral scanning
- Quick assay optimization with the Spectral Optimization Wizard
Introduction
The intrinsic fluorescence of proteins is due to the aromatic amino acids tryptophan, tyrosine, and phenylalanine. Tryptophan, which excites maximally around 270-280 nm and has an emission peak near 350 nm in water, dominates the emission of proteins and is the most sensitive to solvent polarity and the local environment. Exposure of tryptophan residues to water, which occurs when a protein is denatured, leads to a shift to longer emission wavelengths. This shift in peak emission can be used to monitor protein unfolding.
Here, we demonstrate performance of the SpectraMax® iD3 Multi-Mode Microplate Reader for assays measuring intrinsic tryptophan fluorescence. High sensitivity is demonstrated with a tryptophan standard curve, and a shift in peak emission is shown using a lysozyme denaturation assay. Lysozyme contains two tryptophan residues that fluoresce when excited with UV light. When lysozyme is denatured, tryptophan’s emission peak shifts about 6-10 nm. This peak shift can be measured by performing fluorescence spectral scans on native and denatured lysozyme.
The SpectraMax iD3 reader offers the sensitivity and wavelength scanning capability needed to perform intrinsic tryptophan fluorescence measurements. Additionally, SoftMax® Pro Software automatically identifies the optimal excitation and emission wavelengths via the Spectral Optimization Wizard. The shift in emission peak is also automatically calculated for streamlined analysis.
Materials
- SpectraMax iD3 Multi-Mode Microplate Reader (Molecular Devices cat. #ID3-STD)
- L-Tryptophan (Sigma cat. #T-0254)
- Lysozyme (Sigma cat. #L6876)
- Guanidine hydrochloride (Sigma cat. #G7294)
- Clear-walled, UV-clear 96-well microplate (Greiner cat. #655801)
- Phosphate buffered saline (PBS), pH 7.4
Method
A two-fold dilution series of tryptophan starting at 100 µM was prepared and pipetted in triplicate into a UV-clear, 96-well microplate at 200 µL/well. Six wells of PBS were used as blanks for calculating the lower limit of detection (LLD). SoftMax Pro Software’s Spectral Optimization Wizard was used to
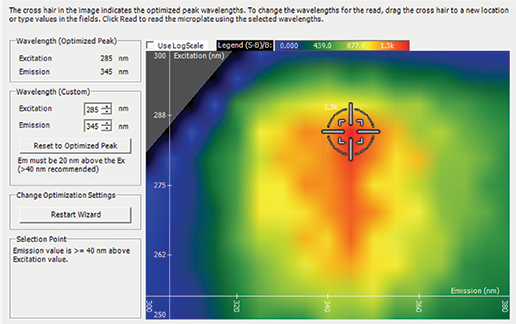
Figure 1. Spectral Optimization Wizard. SoftMax Pro Software’s Spectral Optimization Wizard was used to find the optimal excitation and emission wavelengths for the experiment. The signal-tobackground ratio for the wavelength pairs tested is represented by the heat map. determine the optimal excitation and emission wavelengths for this assay, and the tryptophan dilution series was detected using this wavelength combination. Guanidine hydrochloride at a final concentration of 5 M was used to denature a 10 mg/mL solution of lysozyme. Spectral scans were performed on native and denatured lysozyme samples using the SpectraMax iD3 reader with excitation at 270 nm and emission ranging from 300 nm to 450 nm. Emission peaks were automatically identified using a preconfigured protocol in SoftMax Pro Software.
Method
Excitation and emission wavelengths were optimized using SoftMax Pro’s Spectral Optimization Wizard (Figure 1). This feature identified the wavelength combination with the best signal-to-noise ratio as excitation at 285 nm and emission at 345 nm. Using the optimal wavelength combination, the SpectraMax iD3 reader was able to accurately measure the tryptophan standard curve with a lower limit of detection at 9.5 nM and excellent linearity with r2 > 0.99 (Figure 2). Spectral scans of native vs. denatured lysozyme samples showed a shift in the emission peak from 350 nm to 355.5 nm, along with a slight increase in fluorescence intensity with denaturation (Figure 3). This emission peak shift was close to expected values.
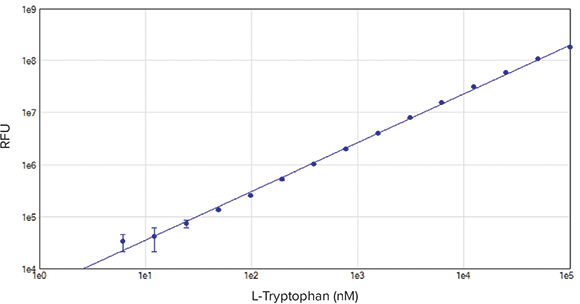
Figure 2. Tryptophan Standard Curve. Tryptophan was serially diluted in PBS to generate a standard curve. Linearity (r2 > 0.99), and an LLD of 9.5 nM was calculated.
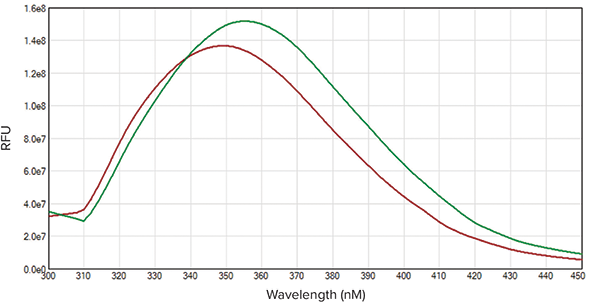
Figure 3. Peak Shift of Denatured Lysozyme. Emission spectral scans of native (red) and denatured (green) lysozymes are shown. A peak shift of 5.5 nM was calculated using SoftMax Pro Software protocol.
Conclusion
The SpectraMax iD3 reader enables protein characterization by measuring intrinsic tryptophan fluorescence. Using 15 nm excitation and 25 nm emission bandwidths, the reader can detect very low concentrations of tryptophan in the low nM range. Additionally, the Spectral Optimization Wizard automatically identifies the optimal excitation and emission wavelengths.
With a preconfigured SoftMax Pro Software protocol, peak wavelength and peak wavelength shift of natured and denatured lysozyme are identified automatically, saving time on analysis.
介绍
蛋白质的内源荧光主要来源于芳香族氨基酸如色氨酸、酪氨酸和苯丙氨酸。在水中,色氨酸的最大激发光波长在270-280nm左右而其发射光波长峰值接近350nm。蛋白的发射光谱对溶剂的极性和外界环境十分敏感。当蛋白质变性时,色氨酸残基会暴露在水中而其发射波长会变长。这种发射波长峰值的改变可以用来检测蛋白质的变性。
在这里,我们将展示如何运用SpectraMax®iD3多功能微孔板读板机检测内源色氨酸荧光。色氨酸标准曲线用来显示检测方法的高灵敏性,而色氨酸发射峰值的偏移则用溶菌酶变性实验来检测。溶菌酶包含有两个色氨酸残基,因此受到紫外光照射时会发射荧光。当溶菌酶降解时,色氨酸的发射光峰值会偏移6-10nm。我们可以对降解前后的溶菌酶进行荧光光谱扫描来捕获和检测发生的峰值偏移。
SpectraMax® iD3多功能微孔板读板机兼具 内源色氨酸荧光检测所需的高灵敏度和波 长扫描能力。另外,SoftMax® Pro 软件可 以通过Spectral Optimization Wizard自动 识别最最佳的激发和发射波长,同时自动 计算发射峰值的偏移,并用于后续分析。
材料
- SpectraMax iD3 多功能微孔板读板机 (Molecular Devices cat. #ID3-STD)
- L-色氨酸 (Sigma cat. #T-0254)
- 溶菌酶 (Sigma cat. #L6876)
- 盐酸胍 (Sigma cat. #G7294)
- UV高透的 96孔板 (Greiner cat. #655801)
- 磷酸盐缓冲液 (PBS), pH 7.4)
结果
利用SoftMax Pro软件的Spectral Optimization Wizard可以将激发光和发射光波长做优化 (图1)。这一特征可以使这些波长的测量有 最优的信噪比(激发光波长285nm,发射 光波长345nm)。
图1 Spectral Optimization Wizard。 SoftMax Pro软件的Spectral Optimization Wizard功能可以 快速优化激发光和发射光波长,通过热图的计算降低信噪比。
通过波长的最优化方式,SpectraMax iD3 读板机可以准确的测量色氨酸的标准曲 线,其检测最低限值可以达到9.5nM并且 有很好的线性(2 >0.99) (图2)。
光谱扫描结果显示在溶菌酶降解后其发射光波长峰值从350nm迁移到355.5nm并伴随荧光强度的略微增强(图3)。这一发射光波长峰值的迁移程度也十分接近预期值。
结论
利用SoftMax Pro软件的Spectral Optimization Wizard可以将激发光和发射光波长做优化 (图1)。这一特征可以使这些波长的测量有 最优的信噪比(激发光波长285nm,发射 光波长345nm)。
通过波长的最优化方式,SpectraMax iD3 读板机可以准确的测量色氨酸的标准曲 线,其检测最低限值可以达到9.5nM并且 有很好的线性(r2 >0.99) (图2)。
光谱扫描结果显示在溶菌酶降解后其发射光波长峰值从350nm迁移到355.5nm并伴随荧光强度的略微增强(图3)。这一发射光波长峰值的迁移程度也十分接近预期值。
图2 色氨酸标准曲线。 色氨酸梯度稀释后得到标准曲线,其检测最低限值可以达到9.5nM并且有很好的线性(r2 >0.99)。
图3 溶解酶素变性后的波谱移位。 溶菌酶素变性前(红)后(绿)发射波谱扫描结果如图所示。通过SoftMax Pro 软件预先设定的程序计算得到波峰位移为5.5nm。
结论
SpectraMax iD3 读板机可以通过测量色氨 酸内源荧光对蛋白定性。利用15nm激发 光和25nm发射光的带宽,读板机可以在 低波长光谱范围内检测低浓度的色氨酸。 另外,Spectral Optimization Wizard可 以自动识别最优化的激发光和发射光波 长。 利用SSpectraMax iD3 读板机可以通过测量色氨 酸内源荧光对蛋白定性。利用15nm激发 光和25nm发射光的带宽,读板机可以在 低波长光谱范围内检测低浓度的色氨酸。 另外,Spectral Optimization Wizard可 以自动识别最优化的激发光和发射光波 长。
利用SoftMax Pro 软件预先设定的程序, 研究人员可以自动检测溶菌酶降解前后的 波长峰值及其迁移,从而节省了大量用于 数据分析的时间。