
Application Note
Monitoring Gq protein-coupled receptor activation on the SpectraMax i3x reader with injector module
- EC 50 and IC 50 values agree closely with previously published values on high-throughput screening systems
- Minimal dead volume saves costly compounds
- Real-time cell monitoring is easily configured using SoftMax Pro Software
- Compatible with FLIPR Calcium Assays
Introduction
Gqprotein-coupled receptor activation is commonly monitored in live cells in real time using calcium-sensitive dyes on a fluorescence plate reader. Automated liquid handling within the plate reader is generally required to deliver agonist compounds to the cells in the microplate while the detection system takes real-time readings of compound-induced changes in fluorescence intensity values. Analysis of the resulting kinetic readings yields information about the compound response profiles, including EC50and IC50values for agonists and antagonists.
In this application note, we describe how the SpectraMax®i3x Multi-Mode Microplate Reader with SpectraMax Injector Module is used to perform calcium assays on two different cell lines. CHO M1WT3 cells are Chinese hamster ovary cells stably transfected with the M1 muscarinic Gq-coupled receptor. 1321N1, a human astrocytoma cell line, expresses endogenous muscarinic cholinergic receptors. Data analysis performed using SoftMax® Pro Software yielded accurate EC50and IC50values for both cell lines, comparable to previous results obtained using high-throughput screening systems. The Acquisition Editor, a graphical user interface in the software, facilitated setup of the assay’s injector and detection parameters (Figure 1).
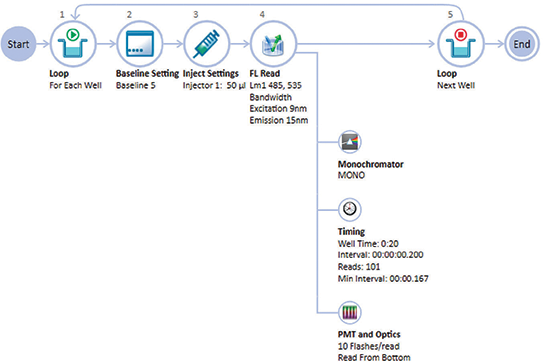
Figure 1. Acquisition Plan for calcium assay on the SpectraMax i3x reader. The Acquisition Editor in SoftMax Pro Software provides a graphical drag-and-drop interface for easy assay setup.
Materials
- CHO M1WT3 cells (ATCC cat. #CRL-1985)
- 1321N1 cells (ECACC cat. #86030402)
- Agonist compound
- Carbamoylcholine chloride (carbachol; Sigma cat. #C4382)
- Acetylcholine chloride (Sigma cat. #A6625)
- Antagonist compounds
- Atropine (Sigma cat. #A0132)
- FLIPR ® Calcium 6 Assay Kit(Molecular Devices cat. #R8190)
- 1 M HEPES (Thermo cat. #15630-080)
- ReadiUse ™ water-soluble probenecid (AAT Bioquest cat. #20061)
- SpectraMax ® i3x Multi-Mode Microplate Reader
- SpectraMax Injector Module
- FlexStation ® 3 Multi-Mode Microplate Reader
Methods
Cell preparation
CHO M1WT3 cells were seeded into a 96-well black-wall, clear-bottom plate at 50,000 cells per well in 100 µL per well. They were incubated overnight at 37°C, 5% CO2.
1321N1 cells were used as an ‘assay-ready’ reagent. Briefly, one vial of frozen cells (\~ 10 million cells per mL) was thawed rapidly in a 37°C water bath and re-suspended in 10 mL of DMEM medium. The cells were centrifuged for five minutes at 1,000 RPM, the medium was discarded, and then the cells were suspended at 300,000 cells per mL in fresh DMEM. Cells were then seeded into a 96-well black-wall, clear-bottom plate at 30,000 cells per well in 100 µL per well. They were incubated overnight at 37°C, 5% CO2.
For both cell lines, calcium assays were performed on the day after cells were seeded in microplates.
Reagent preparation
30 mL of assay buffer were made by adding 0.6 mL of 1 M HEPES to 29.4 mL of 1X HBSS. This assay buffer was used in the preparation of other assay reagents. A 25 mM probenecid stock solution was made by dissolving one vial of probenecid in 10 mL of assay buffer. A solution consisting of 1 mL of 25 mM probenecid and 10 mL of assay buffer was used to reconstitute a vial of Dye Loading Buffer (provided in the Calcium 6 assay kit), and the vial was vortexed for 30 seconds to mix.
Dye loading
To each well of the microplate containing cells, 100 µL of Dye Loading Buffer was added. The plate was then incubated for two hours at 37°C, 5% CO2. Cells were not washed prior to assay.
Compound preparation
For the agonist assays, 5X working stocks of carbachol (CHO M1WT3 cells) or acetylcholine (1321N1 cells) were prepared in assay buffer. 1:3 dilution series of the working stocks were made in 4-mL polypropylene tubes. A full concentration-response curve, consisting of eight concentrations, was prepared for each compound.
The antagonist atropine was prepared as a 1:3 dilution series. Working stocks were added to the wells of the assay plates to achieve the appropriate final concentrations, and the plates were equilibrated for 30 minutes. The injector was then used to deliver agonist at EC80concentration to the wells.
Cell-based assay setup
Agonist concentration response curves were run on the SpectraMax i3xreader with a SpectraMax Injector Module, one compound concentration at a time. For each curve, the assay was run from low to high concentration to minimize carryover. Injector 1 was primed with compound, then the dye-loaded cell plate was placed in the instrument and the assay was run on a set of three replicates. For each well, 50 µL of 5X compound working stock was injected into the 200 µL of cells, medium, and Dye Loading Buffer already in the well, for a final 1X concentration of compound.
The injector was then reversed to remove compound from the line and primed with the next highest concentration of compound. A new plate section was created, and the assay was run on the next set of replicate wells. This process was repeated for each compound concentration, with a new plate section being created for each set of replicates, until the concentration-response curve was completed.
The Acquisition Plan in SoftMax Pro Software was used to define the instrument and injector settings (Figure 1).
Antagonist studies were done by manually pipetting antagonist dilution series to the wells of the assay plate containing dyeloaded cells, equilibrating for 30 minutes, and then running the kinetic assay on the SpectraMax i3x reader with injection of a single EC80concentration of agonist into all the assay wells.
As a control, additional wells in the same dye-loaded cell plate were assayed on the FlexStation 3Multi-Mode Microplate Reader, which uses an integrated multichannel pipettor to deliver compound to the wells. Instrument settings for the FlexStation 3 reader are shown in Table 1.
Fluorescence
Bottom read
Ex 485 nm
Em 525 nm
Cutoff 515 nm
Readings: 3
PMT: Medium
Run time: 90 sec
Interval: 2.1 sec
Initial volume: 150 µL
Transfers: 1
Pipette height: 150 µL
Volume: 50 µL
Rate: 2
Time Point: 19 sec
Table 1. FlexStation 3 reader settings for calcium assay
Results
Consistent agonist concentration response curves were achieved on the SpectraMax i3x reader by using the injector module to deliver each compound dilution in a separate plate read step. The compounds were run from low to high concentration to avoid carryover issues. Antagonist assays, which involve the delivery of a single EC80concentration of agonist to wells containing cells and antagonist compound, were done as a single plate read.
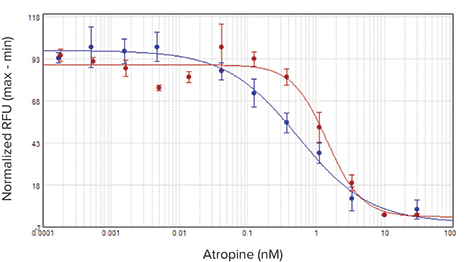
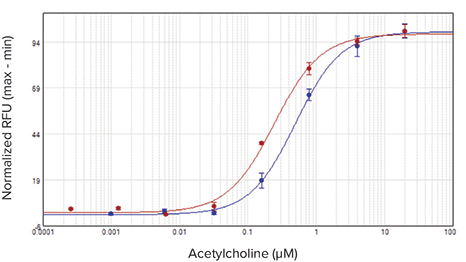
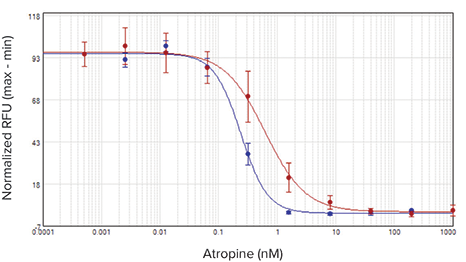
The agonist carbachol activated the M1 muscarinic receptor expressed in CHO M1WT3 cells with an EC50value of 32.8 nM on the SpectraMax i3x reader and 21.7 nM on the FlexStation 3 reader (Figure 2). Atropine antagonized this activation with IC50values of 0.54 nM and 1.4 nM, respectively (Figure 3). The muscarinic acetylcholine receptor (mAChR) expressed in 1321N1 cells was activated by acetylcholine with EC50values of 0.50 µM and 0.24 µM (Figure 4), and antagonized by atropine with IC50values of 0.24 nM and 0.62 nM (Figure 5). Table 2 summarizes the concentration response values obtained for both cell lines.
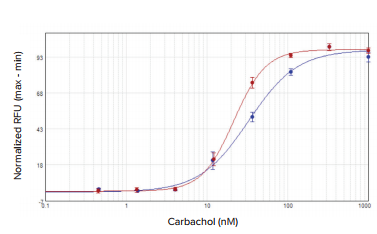
Figure 2. CHO M1WT3 agonist concentration response curves. Cells were treated with carbachol and assayed for calcium response on the SpectraMax i3x reader with injector module (blue) or the FlexStation 3 reader (red)
Agonist EC
50
Antagonist IC
50
Table 2. Summary of EC50and IC50values obtained on the SpectraMax i3x reader with injector module and on the FlexStation 3 reader.
Conclusion
Using the SpectraMax Injector Module, we obtained concentration response curves with EC50and IC50values agreeing closely with previously published values on high-throughput screening systems. Compound delivery parameters and realtime cell monitoring were easily configured using the Acquisition View in SoftMax Pro Software. Results using the injectorbased system agreed closely with those previously acquired using the FlexStation 3 reader with onboard pipettor, and with data from the FLIPR Tetra®High-Throughput Cellular Screening System.
Learn more about SpectraMax i3x Multi-Mode Detection Platform >>
简介
Gq 蛋白偶联受体激活过程通常借助于具有 荧光功能的微孔板读板机来实时监测钙敏 感的荧光染料与细胞内钙离子的结合来实 现。通常我们会通过微孔板读板机内的自 动移液装置将激动剂化合物加到预铺细胞 的孔板中,然后读板机检测系统实时监测 化合物引起的荧光强度值的变化,对动力 学检测结果进行分析,可以得到关于化合 物响应曲线的一些信息,其中包括激动剂 和拮抗剂的 EC50 和 IC50 值。
和拮抗剂的 EC50 和 IC50 值。 在本篇应用文献中,我们介绍了如何利用 配有注射器模块的 SpectraMax®i3x 多功 能微孔板读板机来对两种不同的细胞系进 行钙离子浓度测定。 CHO M 1 WT 3 是采用中国仓鼠卵巢细胞 稳定转染 M 1 毒蕈碱的 Gq 受体细胞,1321 N 1 是人星形细胞瘤细胞系具有内源性毒蕈 碱胆碱能受体,借助于 SoftMax®Pro 软件 的数据分析功能精确获得两个细胞系的 EC50 和 IC50 值,我们与以前使用高通量筛 选系统获得的结果进行比较。在软件的 Acquisition Editor 界面下,流程化界面 方便我们设置注入器的相应参数 ( 图 1 所 示 )。
***图 1 SpectraMax i3x 多功能微孔板读板机进行钙流检测。*SoftMax Pro 软件中 Acquisition Editor 界面下提供了一个流程的图形化流程,可以方便进行设置
材料
- CHO M 1 WT 3 cells (ATCC cat. # CRL - 1985)
- 1321 N 1 cells (ECACC cat. # 86030402)
- 受体激动剂化合物
- 卡巴胆碱 (carbachol; Sigma cat. # C 4382)
- 乙酰胆碱氯化物 (Sigma cat.# A 6625)
- 拮抗剂化合物
- 阿托品 (Sigma cat. # A 0132)
- FLIPR® Calcium 6 Assay Kit (Molecular Devices cat. # R 8190)
- 1 M HEPES (Thermo cat. # 15630 - 080)
- ReadiUse™ water - soluble probenecid (AAT Bioquest cat. # 20061)
- SpectraMax®i3x 多功能微孔板读板机
- SpectraMax 注射器模块
- FlexStation®3 多功能微孔板读板机
方法
准备细胞
将 CHO M 1 WT 3 细胞预铺于 96 孔黑色透 明底的微孔板中,密度大约每孔 50,000 细 胞/100 μL。5 % 二氧化碳以及 37 摄氏度 环境下过夜培养。
1321 N 1 细胞作为“试 验准备”试剂迅速解冻,简而言之,一瓶 冻存细胞 ( 大约 1,000,000 细胞/ml ) 在 37 度水浴锅中迅速解冻后用 10 ml 的 DMEM 培养基重悬,细胞以每分钟 1000 转的速度 离心 5 分钟后,去除培养基,随后将这些 细胞以 300,000 细胞/ml 密度放置于新鲜 的 DMEM 培养基中,细胞预铺于黑色底透 的 96 孔板中,每孔 30,000 细胞/100 μL, 5 % 二氧化碳以及 37 摄氏度环境下过夜培 养。
对于这两种细胞系,第二天,针对预铺的 细胞进行钙离子浓度的检测。
准备染料
每块微孔板中预铺有细胞的孔中加入 100 μL 荧光染料缓冲液,5 % 二氧化碳以及 37 摄 氏度环境下培养 2 小时,细胞进行检测前 无需清洗。
准备化合物
针对激动剂相关检测实验,5 X 的卡巴胆碱 ( CHO M 1 WT 3 细胞 ) 或乙酰胆碱 ( 1321 N 1 细胞 ) 工作缓冲液预先配备于实验以前, 1 : 3 比例进行梯度稀释工作缓冲液于 4 ml 聚丙烯试管中。每种化合物制备了 8 种浓 度溶液以便于生成相应浓度的效应学曲 线。
我们以 1 : 3 稀释方式制备拮抗剂阿托品溶 液,将工作缓冲液加入到检测板的孔中, 达到适当的终浓度,微孔板静止平衡 30 分 钟,注入器用于将激动剂注入孔中获得 EC80 浓度的值。
基于细胞实验的检测设置
利用具有 SpectraMax 注射器模块的 SpectraMax i3x 微孔板读板机获得激动剂 的浓度效应学曲线,一次一个化合物的浓 度,针对曲线图表中的每条曲线,从低浓 度到高浓度稀释以尽量减少交叉感染。注 射器 1 预充化合物后,然后将染料注射于 细胞板孔中,每组三个重复,随后进行检 测。将预先配置好的 5 X 50 μL 工作缓冲液 加入 200 μL 体系的孔中,最终为 1 X 缓冲 液浓度。
最后反冲试剂于注入器内,将管路中化合 物移除,并注入浓度更高一个级别的化合 物溶液。 建立新的微孔板模板,并在新的一块孔板 重复的孔上进行针对这个一浓度的检测。 针对每个化合物浓度重复这个过程,为每 组浓度复制并创建一个新的模板,直到制 作完成浓度-响应曲线。
在 SoftMax Pro 的 Acquisition 界面下可 以定义仪器和注射器相关设置 ( 图 1 所 示 )。
将拮抗剂的梯度稀释液手动加入含有染料 的细胞孔中,进行拮抗剂作用效果的研 究,平衡 30 分钟左右后,使用具有注射器 模块的 SpectraMax i3x 微孔板读板机进行 动力学检测并分析,将获得 EC80 的激动剂 浓度试剂注射到所有的检测孔中。
作为对 照 , 在 内 置 多 通 道 自 动 移 液 装 置 的 FlexStation 3 多功能微孔板读板机上对孵 育同一染料的孔板进行了检测和分析, FlexStation 3 仪器设置如表 1 所示。
Fluorescence
Bottom read
Ex 485 nm
Em 525 nm
Cutoff 515 nm
Readings: 3
PMT: Medium
Run time: 90 sec
Interval: 2.1 sec
Initial volume: 150 µL
Transfers: 1
Pipette height: 150 µL
Volume: 50 µL
Rate: 2
Time Point: 19 sec
表 1 FlexStation 3 针对钙流检测的设置
结果
在具有注射器模块的 SpectraMax i3x 微孔 板读板机,通过使用该模块将每一种化合 物稀释溶液注入每个单独的孔板模板的方 式进行检测,得到了一系列的激动剂浓度 效应学曲线。这些化合物注射原则是从低 浓度运行到高浓度,以避免交叉影响的问 题。针对拮抗剂检测,其中包括将获得 EC80 浓度的激动剂加入到细胞和拮抗化合 物的孔中,针对单一孔板方式检测。
激动剂卡巴胆碱可激活表达 M 1 毒蕈碱受 体的 CHO M 1 WT 3 细胞,EC50 值在 SpectraMax i3x 微孔板读板机上是 32.8 nM,而在 FlexStation 3 微孔板读板机上 是 21.7 nM ( 图 2 所示 )。
***图 2 CHO M 1 WT 3 细胞中加入激动剂后获得的浓度效应学曲线。*在具有注射器模块的 SpectraMax i3x 读板机 ( 蓝色曲线 ) 和 FlexStation 3 读板机 ( 红色曲线 ) 进行相应检测,获得孔板中细胞在加入 卡巴胆碱后钙离子浓度效应学曲线。 阿托品拮抗这种激活作用的 IC50 值分别为 0.54 nM 和 1.4 nM ( 图 3 所示 )
Agonist EC
50
Antagonist IC
50
表 2 如在具有注射器模块的 SpectraMax i3x 读板机和 FlexStation 3 读板机进行相应检测获得 EC50 值和 IC50 值获得结果所示
结论
使用具有 SpectraMax 注入器模块后,我 们获得了相应的浓度效应学曲线,EC50 和 IC50 的值与之前发表的高通量筛选系统获 得的数值非常接近。使用 SoftMax 软件的 Acquisition 界面下可以方便地进行相应参 数的设置,实时监测每孔获得数值。我们发 现使用具有注射器模块的 SpectraMax i3x 读板机或得的结果与之前使用 FlexStation 3 读板机和 FLIPR Tetra® 高通量筛选系统获 得的结果非常一致。
Learn more about SpectraMax i3x Multi-Mode Detection Platform >>